The separation is still not too hard, for two reasons. One, the sun emits incoherent noise, while the DSN signal is carefully designed for coherent detection and processing by the spacecraft receivers. Two, the sun is a broadband source, which divides its power in the band roughly equally across the whole thing, while the DSN signal occupies only a tiny fraction of the band, so its power density is comparable. However, as the Voyagers continue to get farther away, the data rates they can comfortably support continue to decrease.
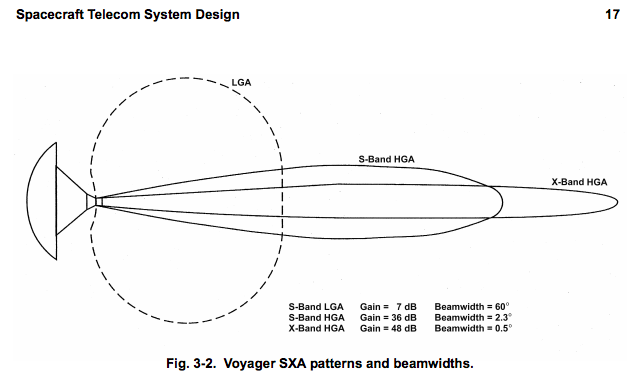
The main reference text for what follows is the DSN Telecommunications Link Design Handbook (Module 202), to which the DESCANSO document linked above directs the reader who wants even more detail than that contained. The DESCANSO text is also useful, answering parts of this question starting about five pages after the beam width graphic posted above, but I'll get to that a bit later.
Phase Coherence
The uplink signal carrier phase is tracked with the classic Costas variant of the digital phase locked loop. Costas, John P., "Synchronous communications", Proceedings of the IRE 44 (12) 1713–1718, 1956, doi:10.1109/jrproc.1956.275063.
The frequency which the PLL tracks measures the Doppler shift caused by the spacecraft motion (for deep space, always receding very rapidly). The beauty of this scheme is that the whole point of a phase-locked loop is to search the input spectrum for anything that might be coherent, and latch onto it while discarding everything else. There are comments below about what happens when the sun gets very close to the line of sight back to Earth, but the problem is not the total power output of the sun; it is the scintillation $-$ the variation of power with time $-$ that forces the PLL to run with so large a tracking bandwidth that it can't lock up properly.
Since the frequency of a carrier equals the rate-of-change of carrier
phase, the Downlink Channel supports Doppler measurement by extracting
the phase of the downlink carrier (Reference 1).
In all of these cases, the accumulating downlink carrier phase is
measured and recorded. When the measurement is one-way, the frequency
of the spacecraft transmitter must typically be inferred. A much more
accurate Doppler measurement is possible when the spacecraft
coherently transponds a carrier arriving on the uplink. In such a
case, the downlink carrier frequency is related to the uplink carrier
frequency by a multiplicative constant, the transponding ratio. Also,
the downlink carrier phase equals the uplink carrier phase multiplied
by this transponding ratio. Thus, when an uplink signal is transmitted
by the DSN and the spacecraft coherently transponds this uplinked
signal, a comparison of the uplink transmitter phase record with the
downlink receiver phase record gives all the information necessary for
an accurate computation of the combined Doppler on uplink and
downlink.
The Receiver and Ranging Processor (RRP) accepts the signal from the
IDC and extracts carrier phase with a digital phase-locked loop
(Reference 2). The loop is configured to track the phase of a
phase-shift keyed signal with residual carrier, a suppressed carrier,
or a QPSK signal.
There is an additional loss to the carrier loop signal-to-noise ratio
when tracking a residual carrier with non-return-to-zero symbols in
the absence of a subcarrier. This loss is due to the presence of data
sidebands overlaying the residual carrier in the frequency domain and
therefore increasing the effective noise level for carrier
synchronization. In this case, $\rho_L$ must be calculated as (Reference 3)
$S_L$ = squaring loss of the Costas loop (Reference 4),
The one-sided, noise-equivalent, carrier loop bandwidth is denoted
$B_L$. The user may choose to change $B_L$ during a tracking pass, and
this can be implemented without losing phase-lock, assuming the change
is not too large. There are limits on the carrier loop bandwidth. $B_L$
can be no larger than 200 Hz. The lower limit on $B_L$ is determined
by the phase noise on the downlink. In general, the value selected for
$B_L$ should be small in order to maximize the carrier loop
signal-to-noise ratio. On the other hand, $B_L$ must be large enough
that neither of the following variables becomes too large: the static
phase error due to Doppler dynamics and the contribution to carrier
loop phase error variance due to phase noise on the downlink. The best
$B_L$ to select will depend on circumstances. Often, it will be
possible to select a $B_L$ of less than 1 Hz. A larger value for $B_L$
is necessary when there is significant uncertainty in the downlink
Doppler dynamics, when the downlink is one-way (or two-way
non-coherent) and originates with a less stable oscillator (such as an
Auxiliary Oscillator), or when the Sun-Earth-probe angle is small (so
that solar phase scintillations are present on the downlink).
The user may select either a type 2 or type 3 carrier loop. Both loop types are
perfect, meaning that the loop filter implements a true accumulation.
In the presence of a persistent Doppler acceleration, a type 2 loop will periodically slip cycles.
They don't have a reference for explaining type 2 versus type 3 filters. A recent one I found interesting was P. Kanjiya, V. Khadkikar and M. S. E. Moursi, "Obtaining Performance of Type-3 Phase-Locked Loop Without Compromising the Benefits of Type-2 Control System," IEEE Transactions on Power Electronics 33(2) 1788-1796, 2018, doi: 10.1109/TPEL.2017.2686440.
References they did put in the above are:
P. W. Kinman, "Doppler Tracking of Planetary Spacecraft", IEEE Transactions
on Microwave Theory and Techniques 40(6) 1199-1204, 1992.
J. B. Berner and K. M. Ware, "An Extremely Sensitive Digital Receiver for Deep
Space Satellite Communications", Eleventh Annual International Phoenix
Conference on Computers and Communications, pp. 577-584, Scottsdale,
Arizona, April 1-3, 1992.
J. Lesh, "Tracking Loop and Modulation Format Considerations for High Rate
Telemetry", DSN Progress Report 42-44, Jet Propulsion Laboratory, Pasadena,
CA, pp. 117-124, April 15, 1978.
M. K. Simon and W. C. Lindsey, "Optimum Performance of Suppressed Carrier
Receivers with Costas Loop Tracking", IEEE Transactions on Communications
25(2) 215-227, 1977.
Power Density
10 MHz is the full range of the RF spectrum allocated for the use of deep space research satellite communication, from 2010 MHz to 2020 MHz. However, the DSN does not fill that uniformly, and the spacecraft do not pay close attention to all channels at once. This is like your radio, which picks up the entire 20 to 30 MHz FM band (exact values differ by country; for example, the US uses 88 to 108 MHz, while Japan uses 76 to 95 MHz), but only listens to one 200 kHz channel at a time. The difference is that, in order for this to work with the Voyagers, the channel instantaneous bandwidth needs to be very small.
The central result of communication theory is the channel capacity formula (Shannon 1948), which relates the theoretical maximum bit rate, $C$, to the occupied signal bandwidth, $B$ (though giving a rigorous theoretical definition of bandwidth is tricky), and the relative power of signal, $S$, and noise, $N$, as
$$C=B\log_2\left(1+\frac{S}{N}\right) $$
Note this uses the ratio $S/N$ not expressed in decibels, so 20 dB SNR means plug in $S/N$ = 100 to obtain $C=B\log_2(101)\approx 6.66 B$. If $S = N$, so $S/N = 1$, then $C = B\log_2(2)=B$. The quantity $1 + S/N$ equals $(S+N)/N$, which is what the display on a spectrum analyzer actually shows when you look at the amplitude of the Fourier transform as a function of offset frequency. If the "hill" you see on the screen is 3 dB high, that means $(S+N)/N=2$, so $S=N$. This statistic is sometimes called the Lawson-Uhlenbeck deflection ratio, in honor of the classic textbook Lawson, J. L., & Uhlenbeck, G. E., Threshold Signals, MIT Radiation Lab Series, Volume 24, New York, McGraw Hill (1950).
The data rates actually used in DSN for Voyager seem ridiculously tiny by near-Earth standards, but channel capacity and power spectral density tell us why it needs to be like that. Voyager Telecommunications on page 60 says
the command processor assembly (CPA) and the command modulator
assembly (CMA) clock out the command bit stream, modulate the command
subcarrier, and provide the modulated subcarrier to the station’s
exciter for modulation of the RF uplink carrier. The command bit
rates, the command subcarrier frequency, and the command modulation
index (suppression of the uplink carrier) are controlled through
standards and limits tables.
...directs the station to
turn command modulation on and selects the 16-bps command rate and a
calibrated “buffer” in the station’s CMA. The CMA produces the command
subcarrier, which produces a 512-Hz square wave to match the
subcarrier tracking-loop best-lock frequency in the Voyager CDU.
Exact numbers from here on depend on how exactly you prefer to define "bandwidth", and just how much of the DSN signal's power fits inside each one. The basic idea is the sun spreads its power nearly uniformly across the whole 10 MHz, as a blackbody in a narrow band is probably the closest nature gets to the theoretically-beloved "additive white Gaussian noise" (AWGN). When you view that on a power spectral density display, you get the result of dividing by bandwidth.
That is, since each bin in your histogram shows, for example, 1 Hz of bandwidth, then only one ten-millionth of the sun's power falls in each bin. If the whole DSN signal falls entirely within one such bin $-$ which is entirely possible if it is operating as an unmodulated carrier $-$ its SNR in that one bin is ten million times what its average SNR is over the whole 10 MHz.
Even when somewhat wider than that, there is still a considerable advantage; for example, if we use 512 Hz as the nominal bandwidth, then in those 512 of your 10 million bins, the DSN SNR will be 10,000,000/512 = 19,500 times higher than its average over all 10 million bins. The "actual" bandwidth of a square wave depends strongly on the author's preference, since it is a sum of all the odd harmonics, which gives the classic $\sin(x)/x$ shape in the frequency domain, with sidelobes that fall rather slowly. However, if we take 512 Hz at face value for $B$, then using 16 bps for $C$ means we only need $1/32 = C/B = \log_2(1+S/N)$, so SNR could theoretically be as low as -16.5 dB and DSN could still get the message through, even before considering things like error-correction coding gain.
Different tasks performed with different modulation schemes require different levels of SNR for equivalently acceptable performance, but explaining what they all are is quite complicated. Instead, I refer you to pages 30 and 31 of Voyager Telecommunications, (in the version at https://descanso.jpl.nasa.gov/DPSummary/Descanso4--Voyager_new.pdf ; it's pages 64 and 65 in the version at https://voyager.gsfc.nasa.gov/Library/DeepCommo_Chapter3--141029.pdf) which shows plots of how the ratio of telemetry power to background noise varies by year and day of year (the curves) versus SNR needed for certain bit rates to provide desired performance (the horizontal dashed and dotted lines). In those plots (which are actually for X band, not S band, but the idea is the same and they're the only ones I could find), variation based on time of year is as large as the difference between 2020 and 2005, but less than the difference between 2005 and 1995 (earlier years have bigger gaps than later ones).
