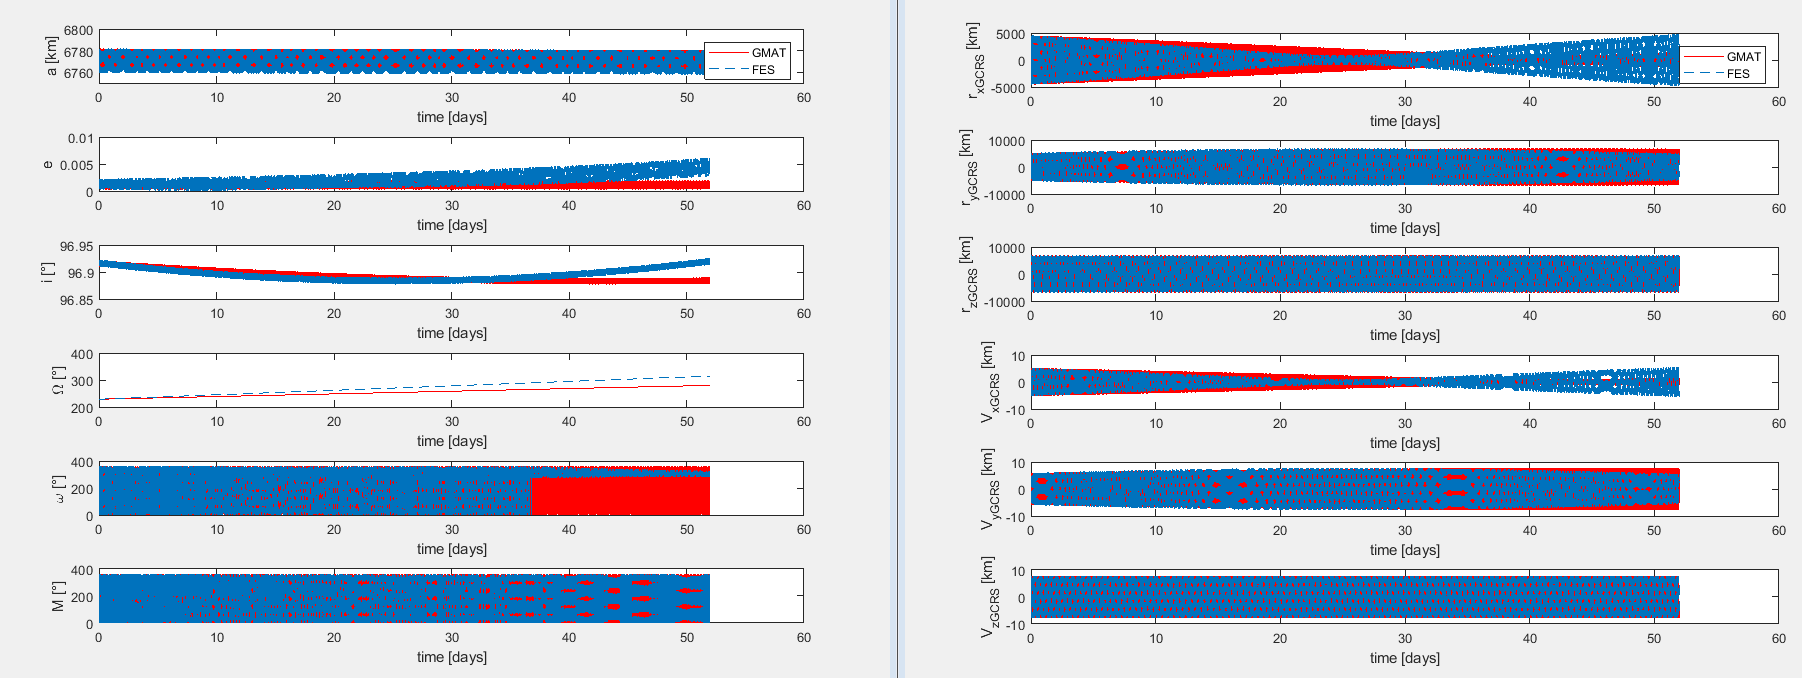
I am a trainee who is working on a numeric orbital propagator developed in the company. I can't show you the code but I can tell you that the propagator was developed to work in Simulink. My job was to extract the propagator in order to use it as a Matlab script. To evaluate the functioning of my script, I am comparing the results obtained with those of another numerical propagator (GMAT). The initial orbital elements are from a SSO Repeat Ground Track orbit. At the moment I am considering the disturbances due only to J2 and I am using a fourth order runge kutta type integrator. The analyzes with the two propagators over a period of 52 days with a fixed step size of 60 sec have the different trends shown in the figure (the left shows the orbital elements while the right shows the state vector).
I cannot explain this difference, particularly in the state vector from which the orbital elements are derived.
At first I thought it was due to the reference systems, as the GMAT data is in the ICRF while my propagator data is in the GCRS. So I used the same conversion functions on the GMAT data and comparing (these new results) with the original ones there were no errors, except those due to the numeric.
So I thought it was the geopotential function that was wrong. But even in this case, passing the same state vector from GMAT, the accelerations calculated by the function were the same as those provided by the software.
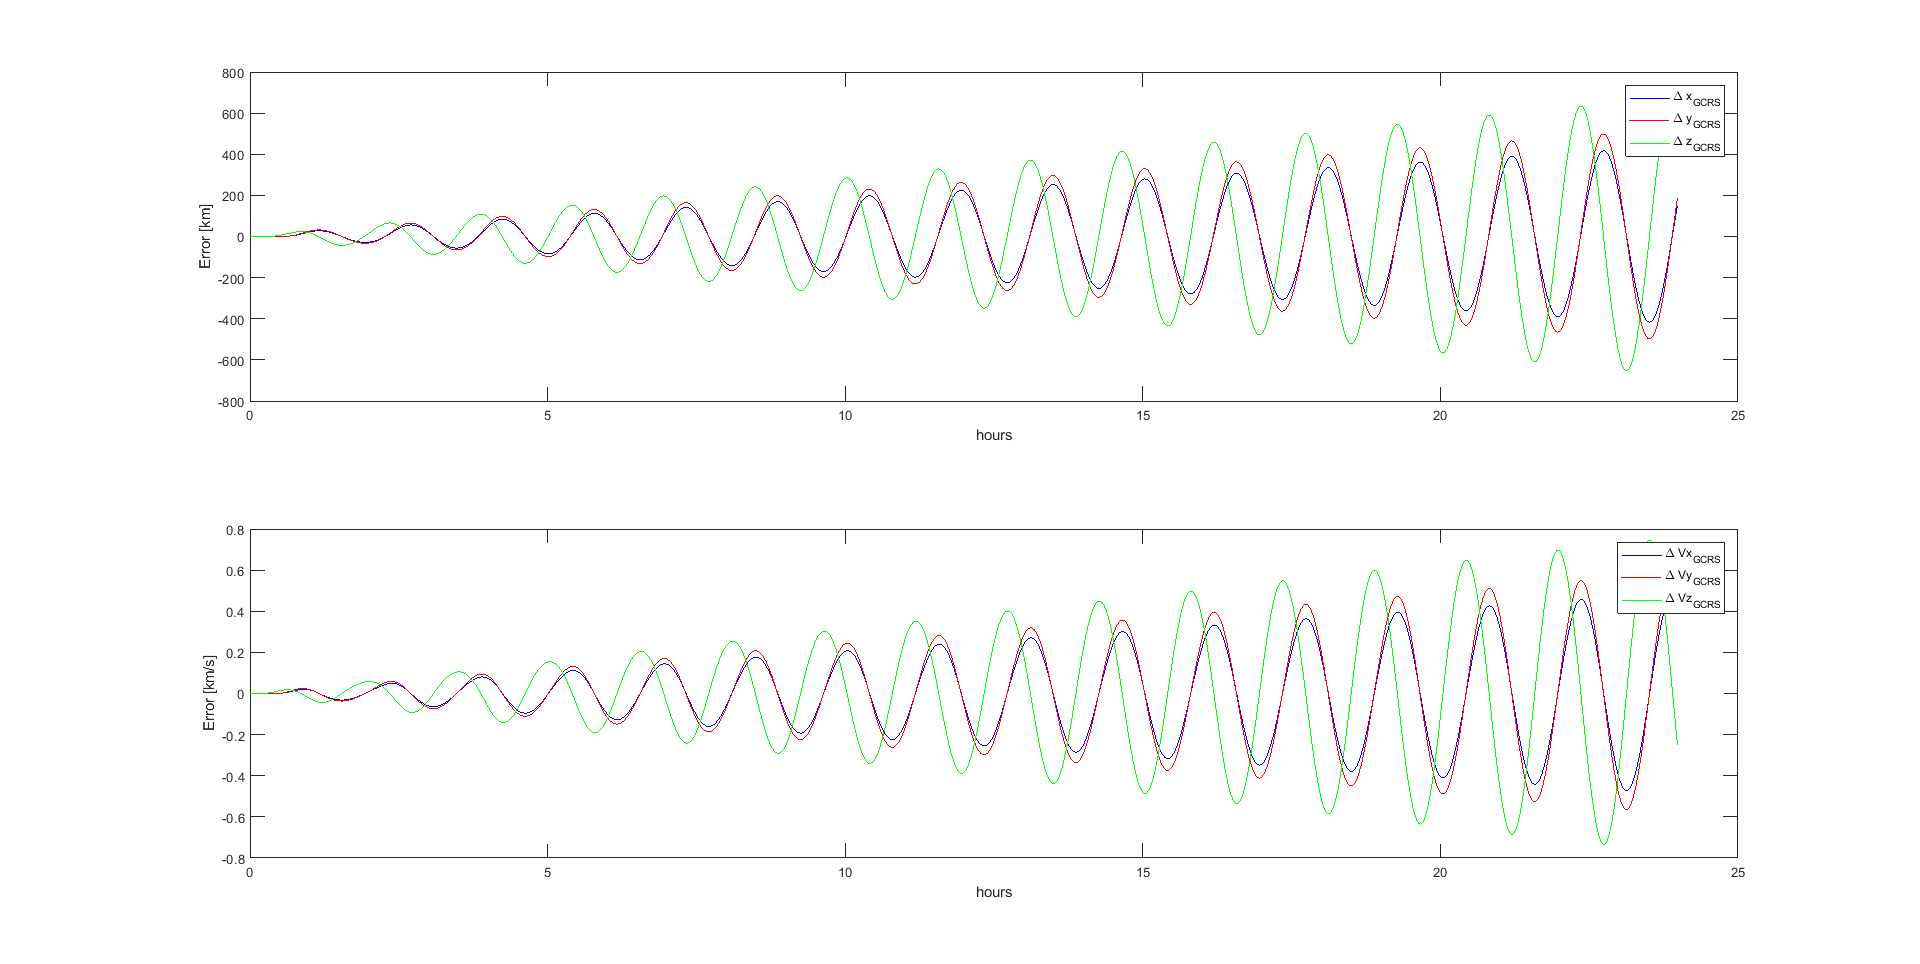
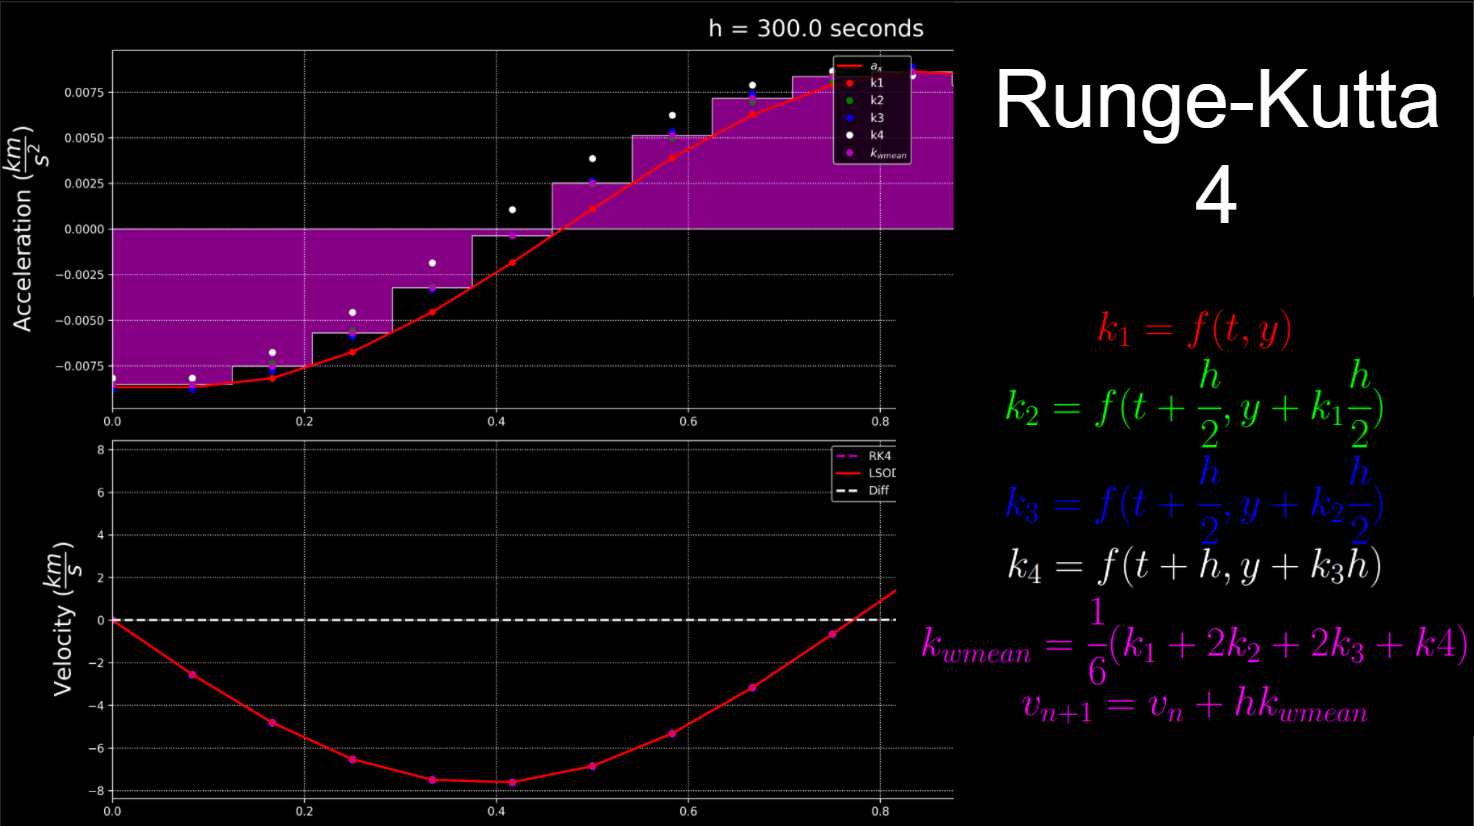
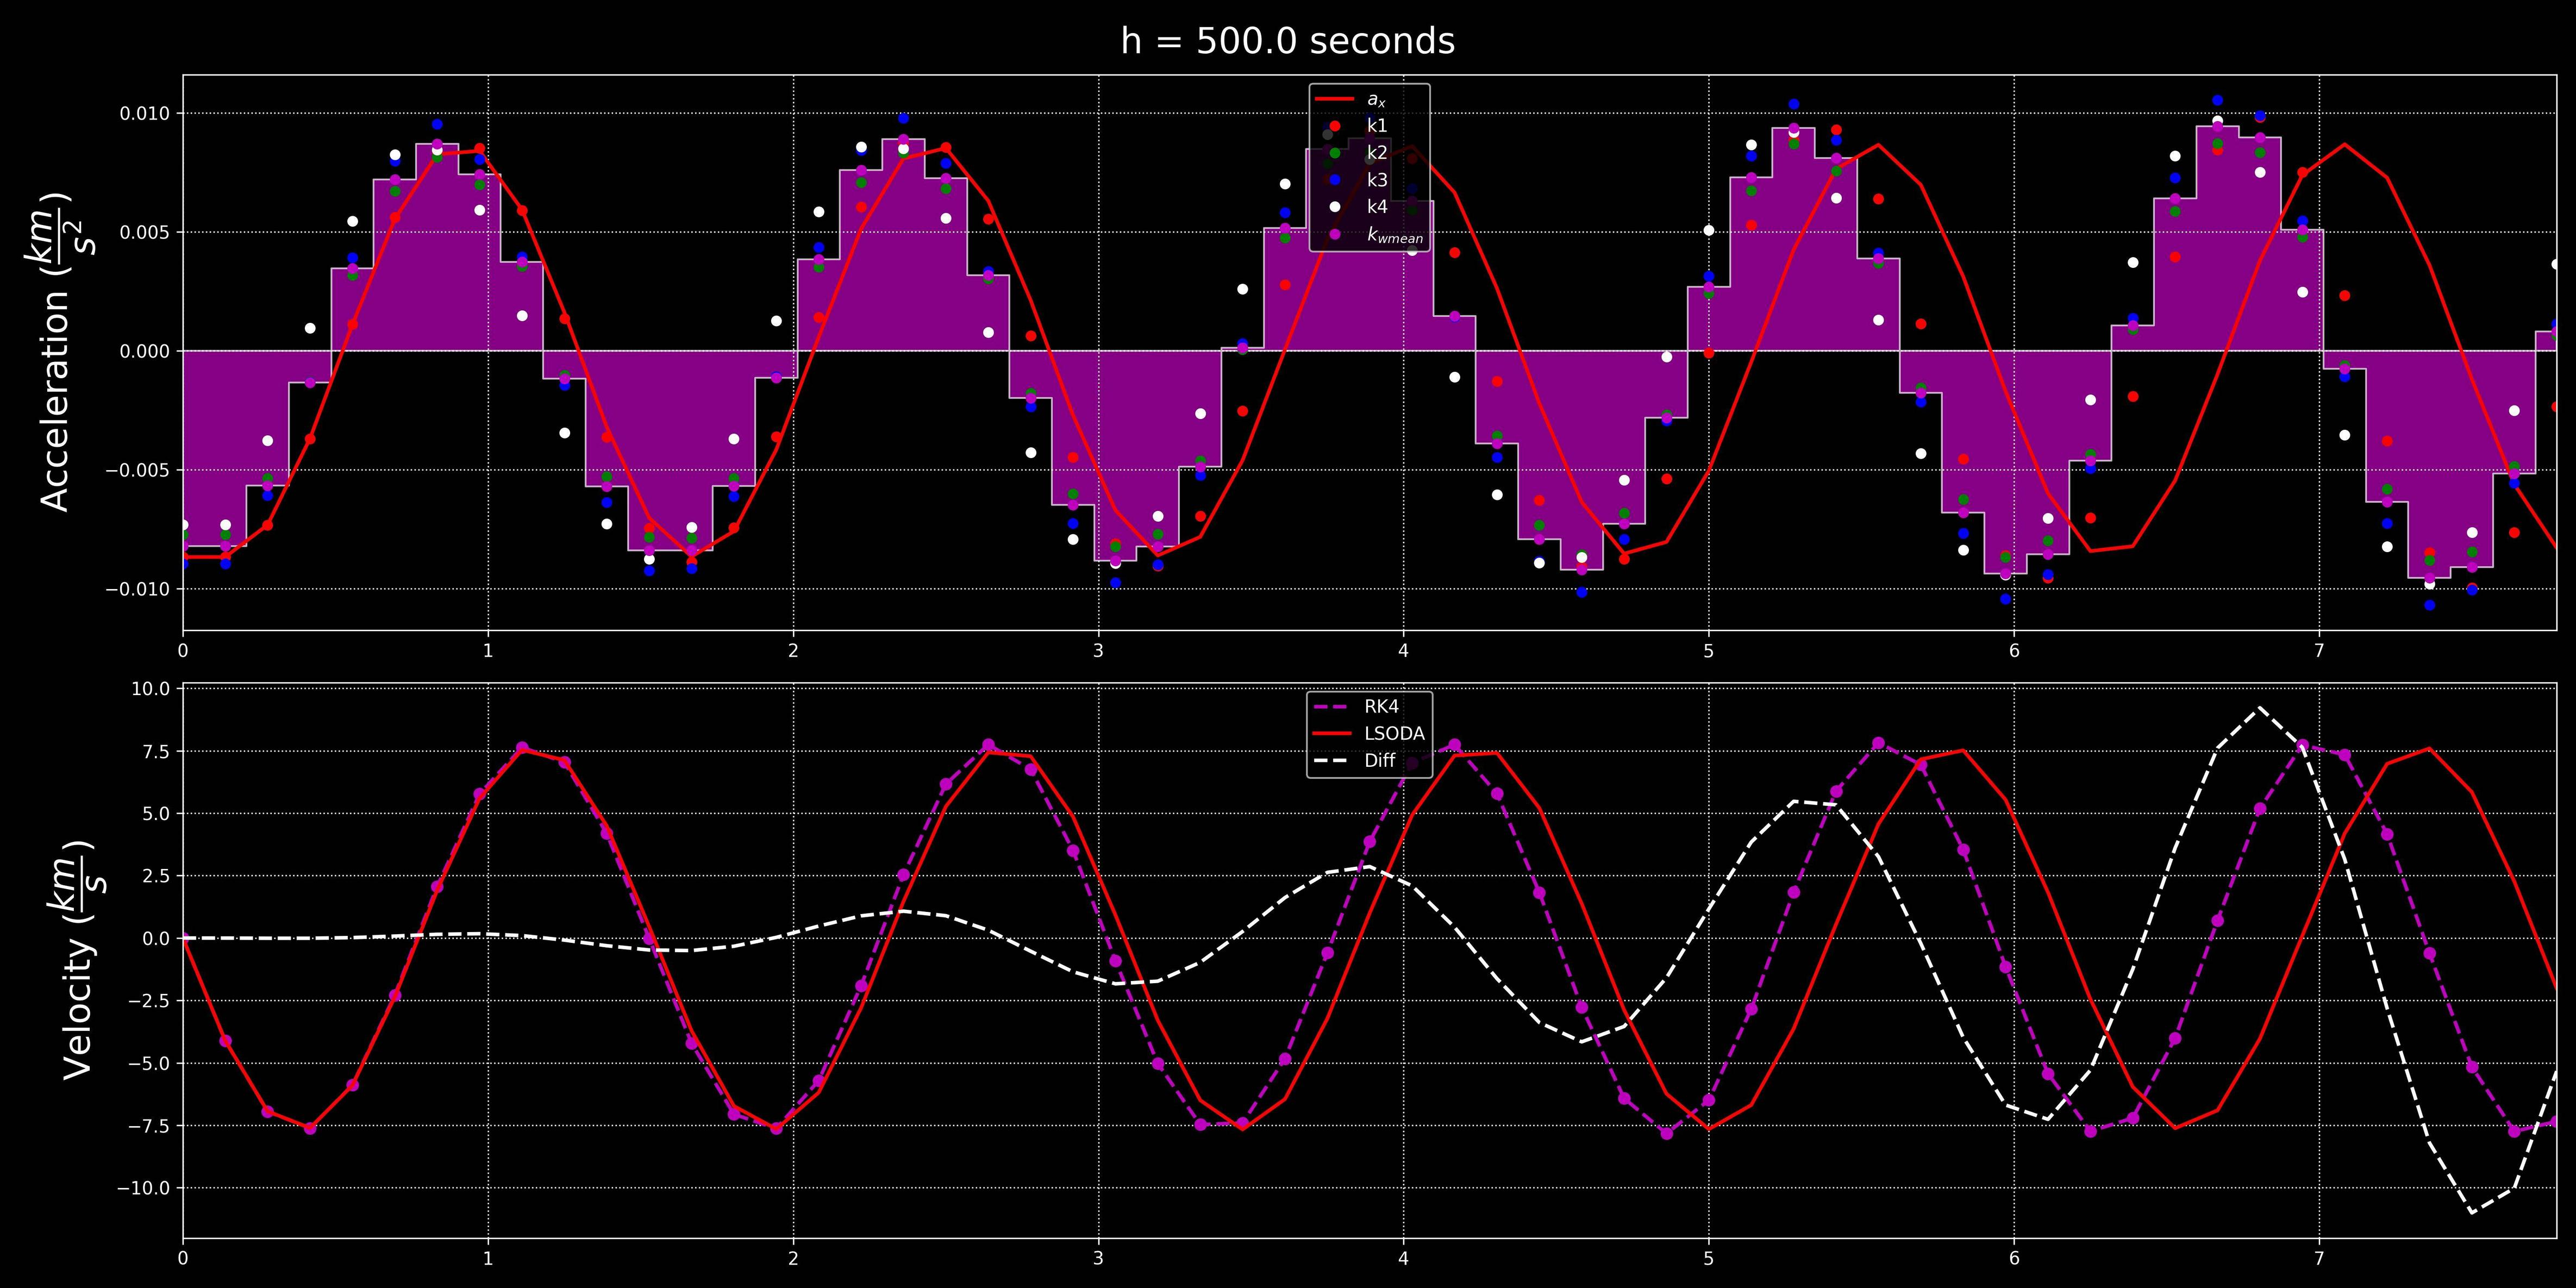
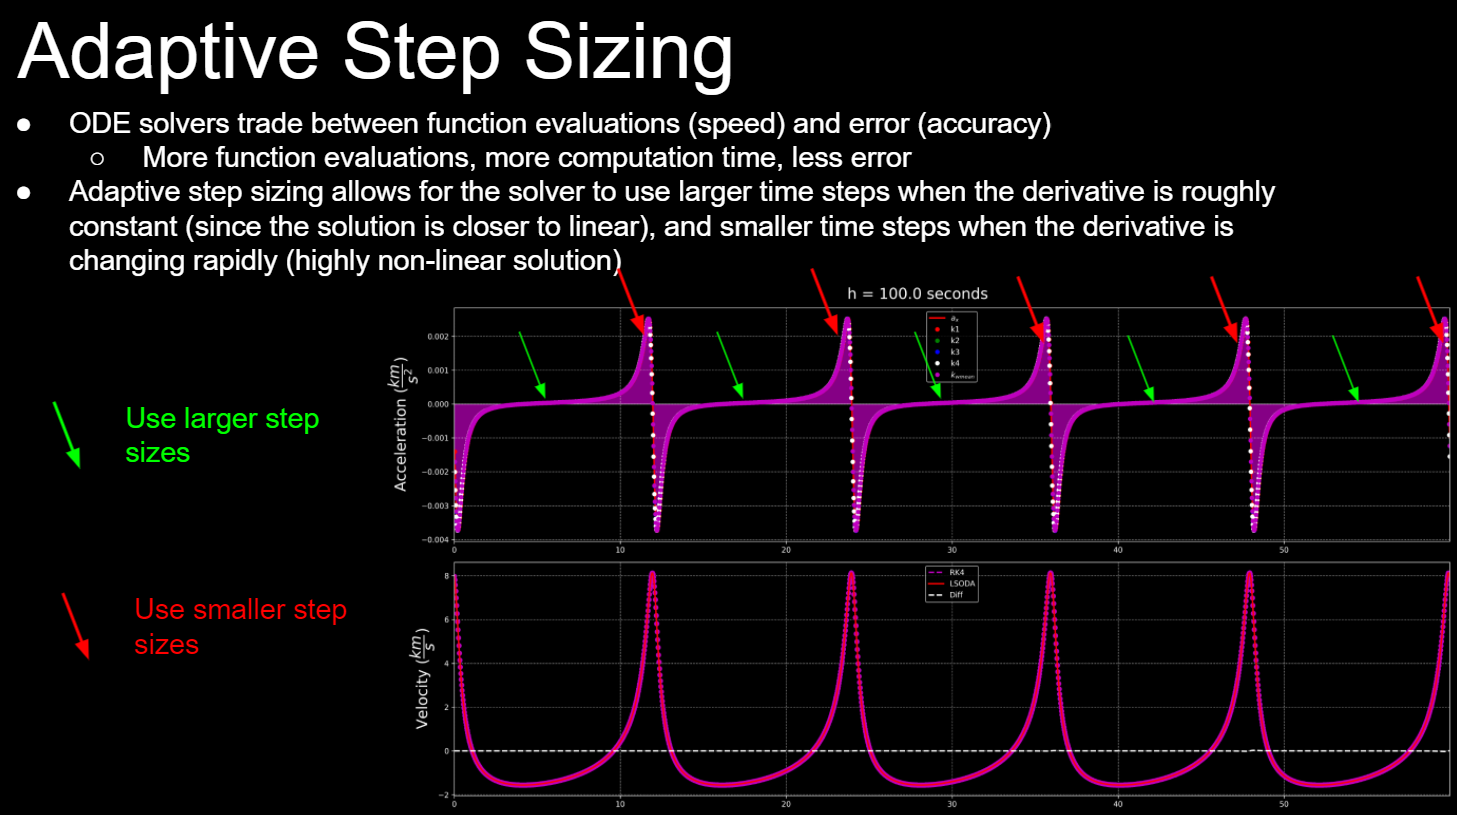
So I think it may be the integrator's fault, as there is the periodic drift of the error shown in the next figure.
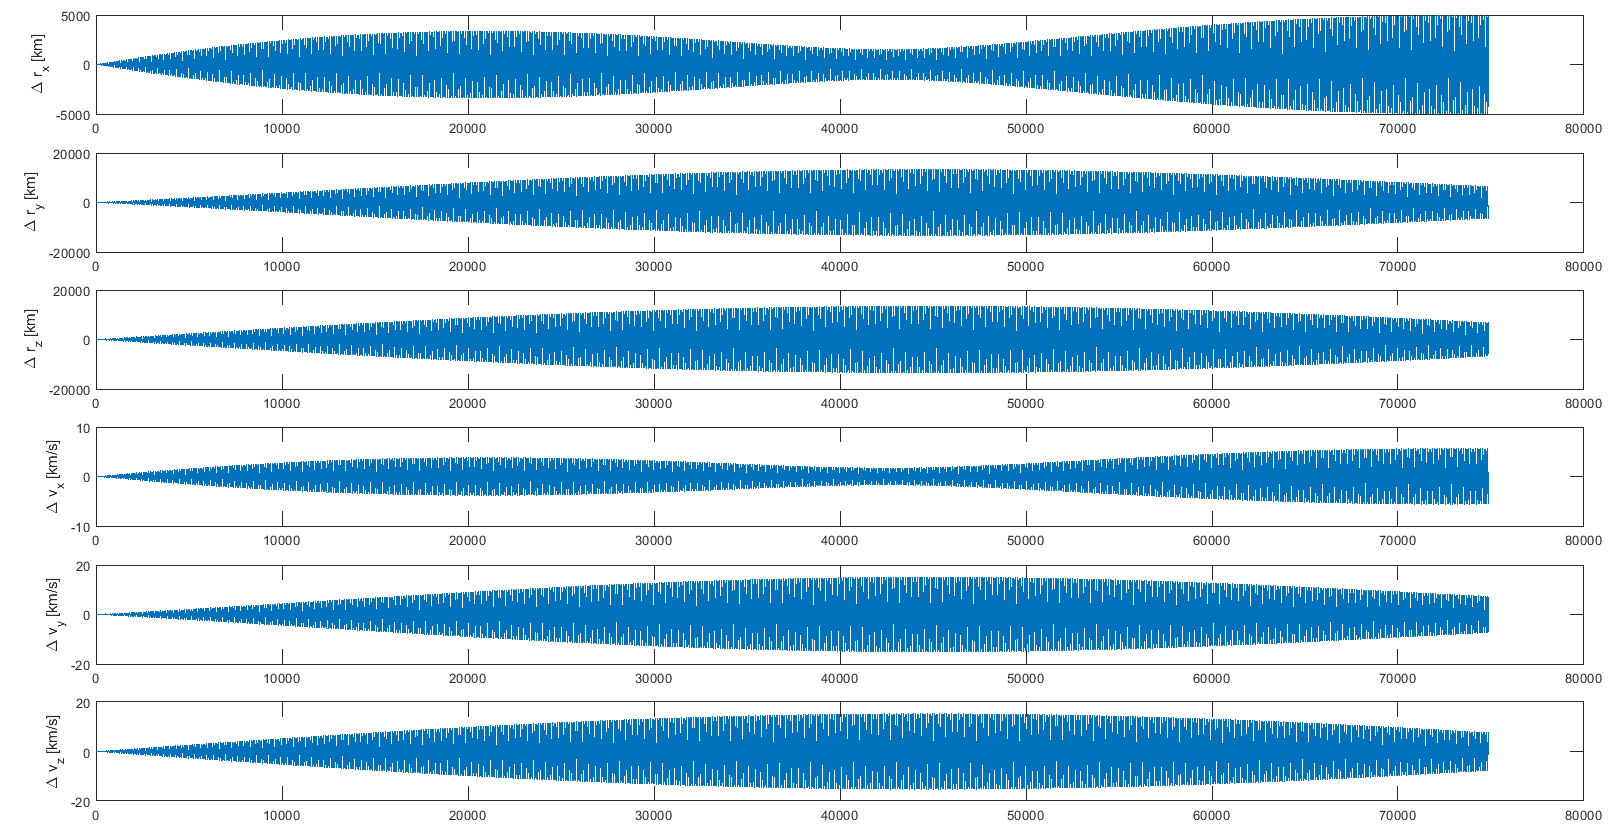
The Runge-Kutta, however, also comparing with what I have found on the web seems to be set up well. Can you think of a reason that explains these discrepancies?
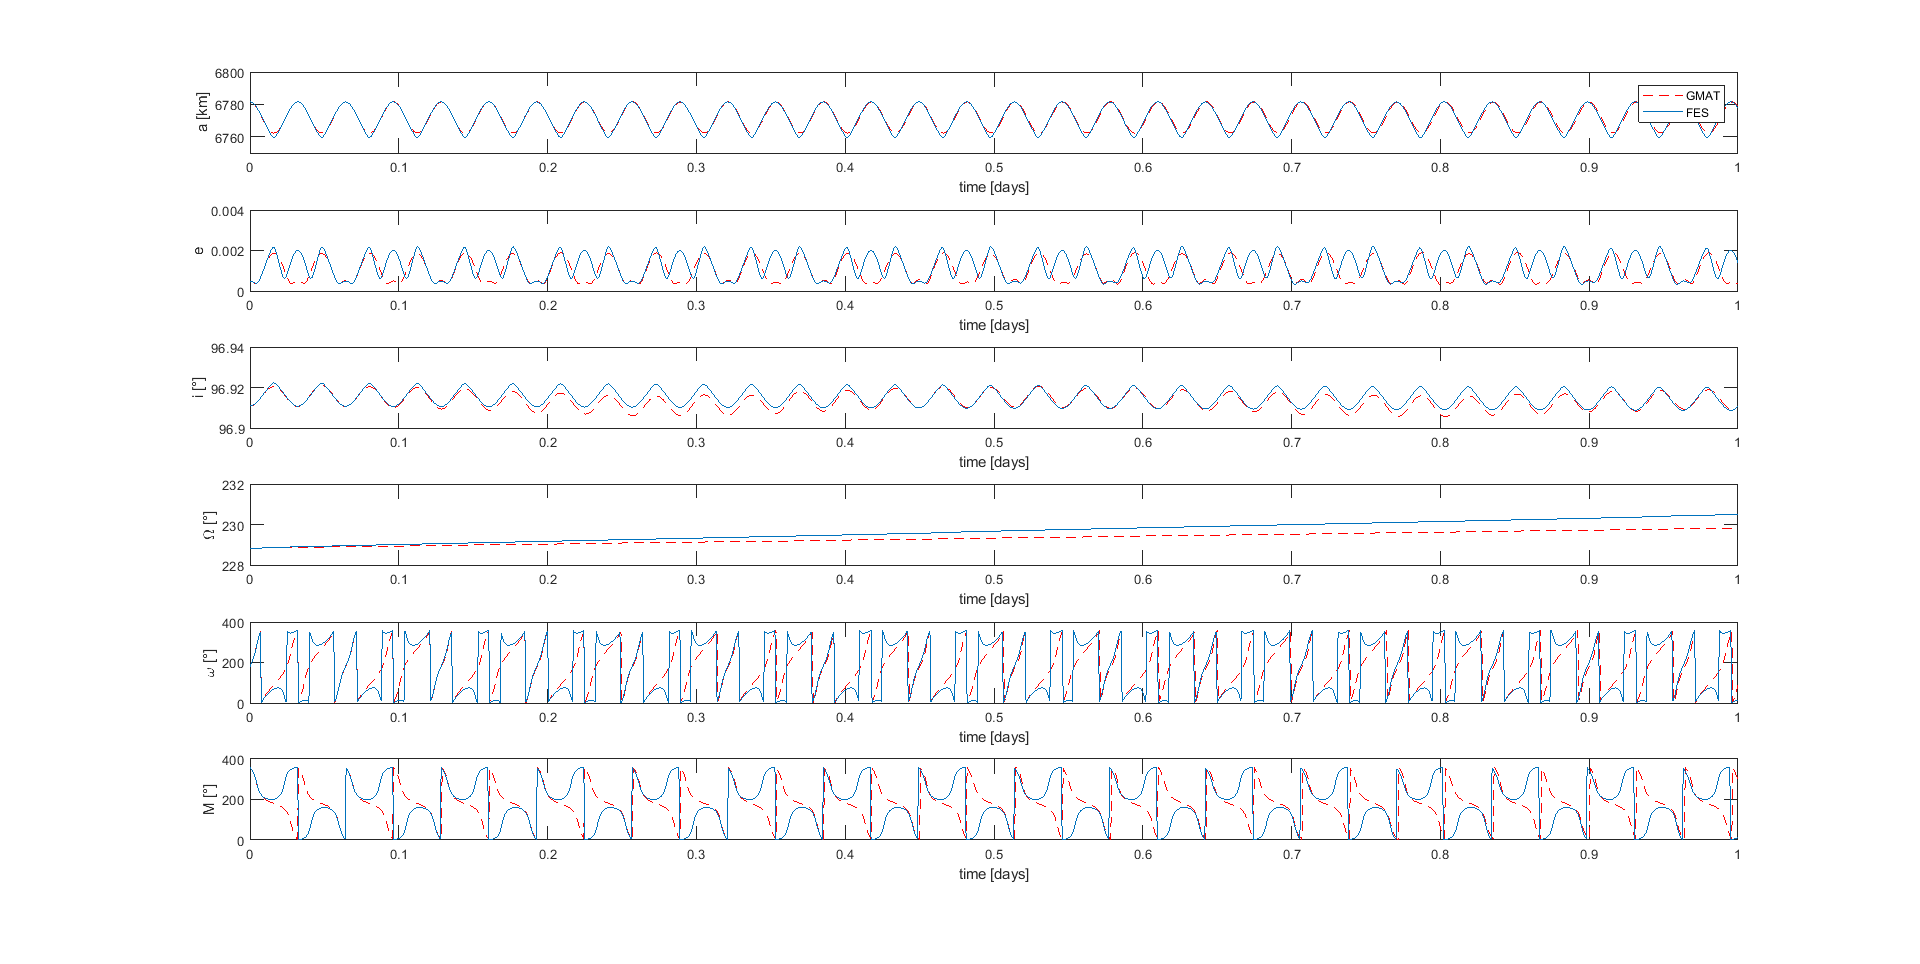
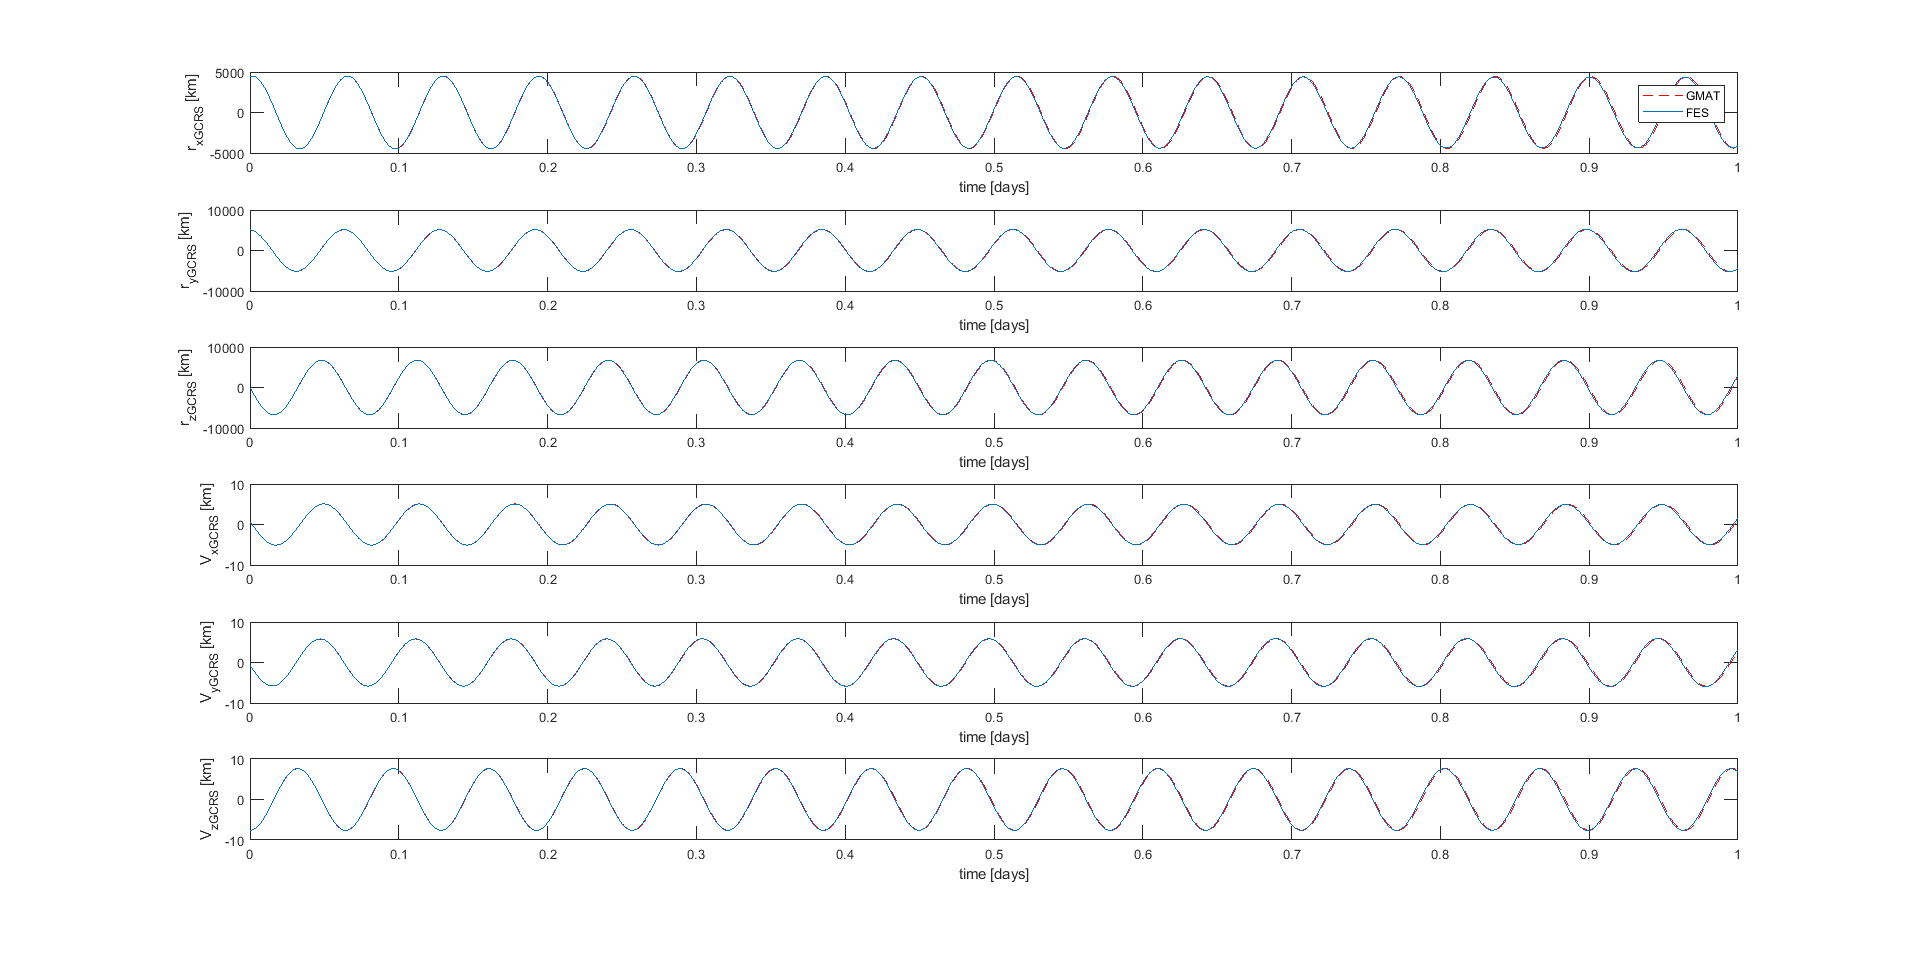
I add more plots to show you the trend of orbital elements and state vector in 24 hours. Over time, the differences tend to increase. In particular, my propagator seems accelerated compared to that of GMAT.
