added 126 characters in body
Source Link
uhoh
  • 151k
  • 56
  • 505
  • 1.6k

On May 1st 2023, with Bangalore at 12.979N, 77.592E I get a distance to the Sun of 1.007313284 AU or 150691922.3 km. You will get slightly different numbers if you used a slightly different lat/longlon, or if you didn't includeincluded the light-time correction that the, I didn't use Skyfield's .observe()'apparent()' method uses herethat does a few more corrections.

distance from Bangalore to the Sun in May 2023 using Skyfielddistance from Bangalore to the Sun in May 2023 using Skyfield

from skyfield.api import Loader, Topos
import numpy as np
import matplotlib.pyplot as plt

load = Loader('~/Documents/fishing/SkyData') # avoid multiple copies of large files
ts = load.timescale()
eph = load('de421.bsp')

earth, sun, moon = [eph[x] for x in ('earth', 'sun', 'moon')]

latlon = 12.979, 77.592
bangalore = Topos(latitude_degrees = latlon[0],
                  longitude_degrees = latlon[1])

days = np.arange(1, 31)

times = ts.utc(2023, 5, days, 0, 0, 0) # 2023-05-01 00:00-2023-05-30 00:00

sun_astrometric = (earth + bangalore).at(times).observe(sun)

both = sun_astrometric.distance().au, sun_astrometric.distance().km

i_annotate = [0, 4, 9, 14, 19, 24, 29]

annots = [[str(val) for val in thing[i_annotate].round(n)]
          for (thing, n) in zip(both, (9, 1))]

annots = np.array(annots)

fig, axes = plt.subplots(2, 1)

goodies = axes, both, ('AU', 'km'), annots

for ax, distance, label, anns in zip(*goodies):
    ax.plot(days, distance)
    for ann, day, dist in zip(anns, days[i_annotate], distance[i_annotate]):
        ax.annotate(ann, (day, dist))
        ax.plot(day, dist, 'ok')
    ax.set_ylabel(label, fontsize=12)

axes[1].set_xlabel('days in May 2023', fontsize=12)

suptitle = ('distance from Bangalore (' + str(latlon) +
            ' to the Sun May 2023 (00:00)')

plt.suptitle(suptitle)

fig.subplots_adjust(left=0.13, right=0.86)
             
plt.show()

On May 1st 2023, with Bangalore at 12.979N, 77.592E I get a distance to the Sun of 1.007313284 AU or 150691922.3 km. You will get slightly different numbers if you used a slightly different lat/long, or if you didn't include the light-time correction that the .observe() method uses here.

distance from Bangalore to the Sun in May 2023 using Skyfield

from skyfield.api import Loader, Topos
import numpy as np
import matplotlib.pyplot as plt

load = Loader('~/Documents/fishing/SkyData') # avoid multiple copies of large files
ts = load.timescale()
eph = load('de421.bsp')

earth, sun, moon = [eph[x] for x in ('earth', 'sun', 'moon')]

latlon = 12.979, 77.592
bangalore = Topos(latitude_degrees = latlon[0],
                  longitude_degrees = latlon[1])

days = np.arange(1, 31)

times = ts.utc(2023, 5, days, 0, 0, 0) # 2023-05-01 00:00-2023-05-30 00:00

sun_astrometric = (earth + bangalore).at(times).observe(sun)

both = sun_astrometric.distance().au, sun_astrometric.distance().km

i_annotate = [0, 4, 9, 14, 19, 24, 29]

annots = [[str(val) for val in thing[i_annotate].round(n)]
          for (thing, n) in zip(both, (9, 1))]

annots = np.array(annots)

fig, axes = plt.subplots(2, 1)

goodies = axes, both, ('AU', 'km'), annots

for ax, distance, label, anns in zip(*goodies):
    ax.plot(days, distance)
    for ann, day, dist in zip(anns, days[i_annotate], distance[i_annotate]):
        ax.annotate(ann, (day, dist))
        ax.plot(day, dist, 'ok')
    ax.set_ylabel(label, fontsize=12)

axes[1].set_xlabel('days in May 2023', fontsize=12)

suptitle = ('distance from Bangalore (' + str(latlon) +
            ' to the Sun May 2023 (00:00)')

plt.suptitle(suptitle)

fig.subplots_adjust(left=0.13, right=0.86)
             
plt.show()
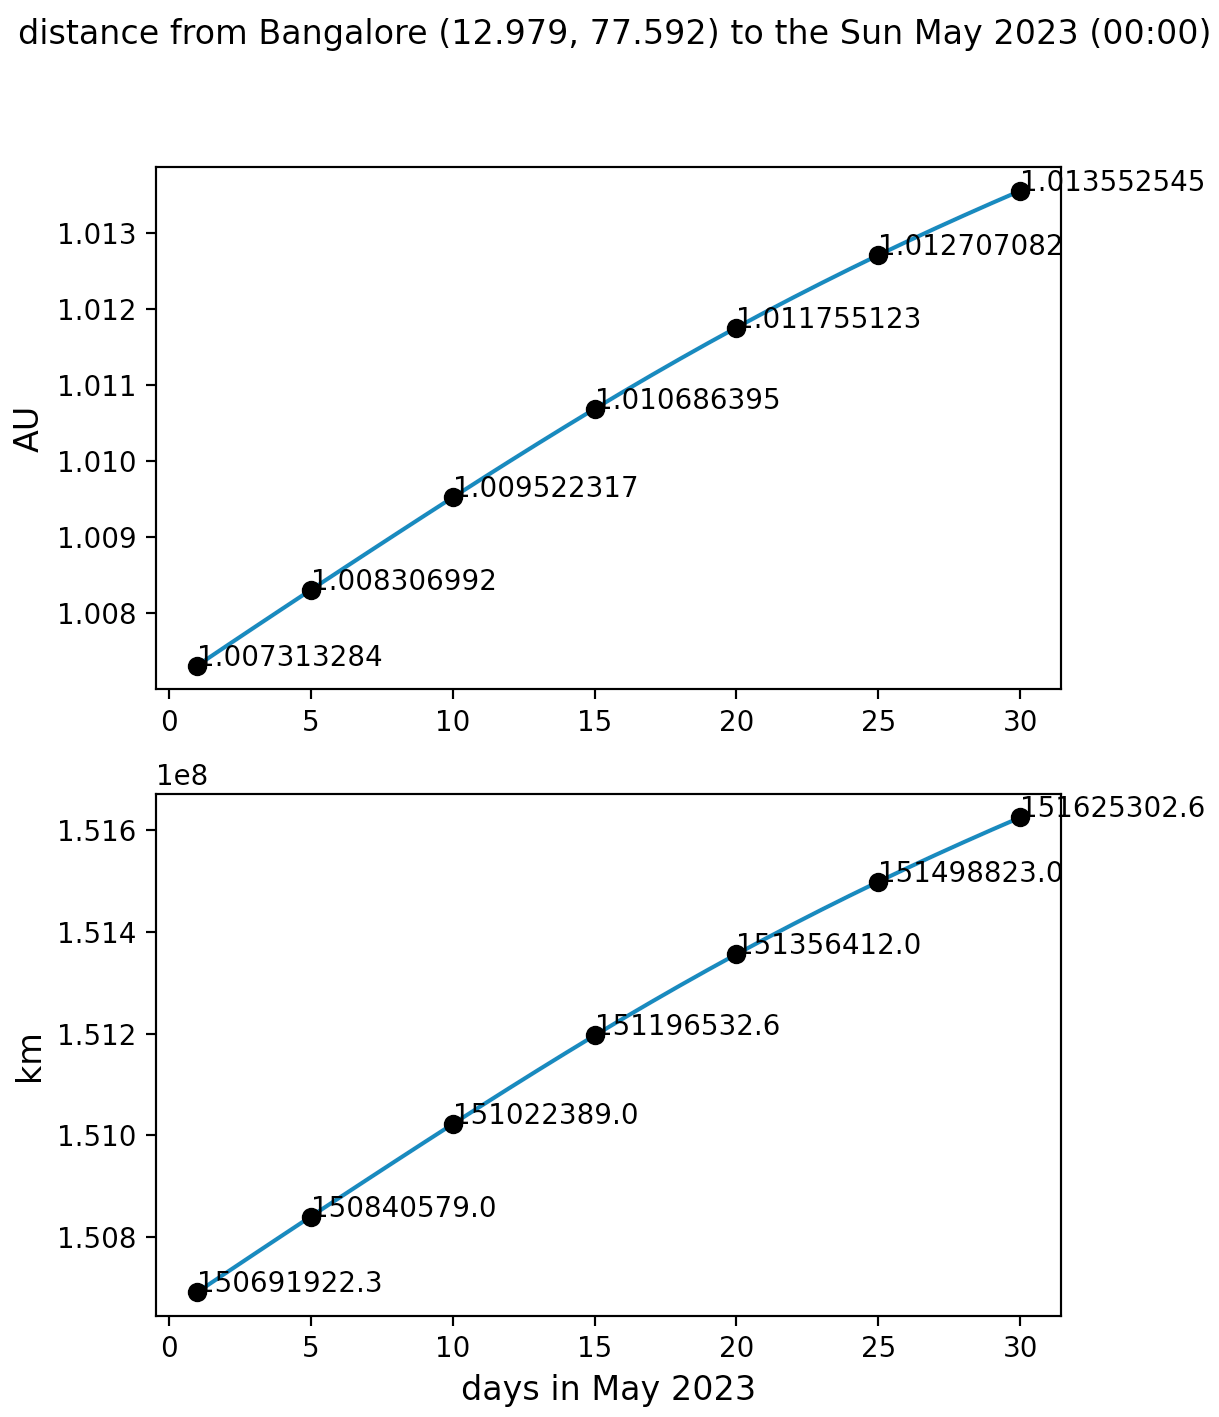
On May 1st 2023, with Bangalore at 12.979N, 77.592E I get a distance to the Sun of 1.007313284 AU or 150691922.3 km. You will get slightly different numbers if you used a slightly different lat/lon, or if you included the light-time correction, I didn't use Skyfield's 'apparent()' method that does a few more corrections.

distance from Bangalore to the Sun in May 2023 using Skyfield

from skyfield.api import Loader, Topos
import numpy as np
import matplotlib.pyplot as plt

load = Loader('~/Documents/fishing/SkyData') # avoid multiple copies of large files
ts = load.timescale()
eph = load('de421.bsp')

earth, sun, moon = [eph[x] for x in ('earth', 'sun', 'moon')]

latlon = 12.979, 77.592
bangalore = Topos(latitude_degrees = latlon[0],
                  longitude_degrees = latlon[1])

days = np.arange(1, 31)

times = ts.utc(2023, 5, days, 0, 0, 0) # 2023-05-01 00:00-2023-05-30 00:00

sun_astrometric = (earth + bangalore).at(times).observe(sun)

both = sun_astrometric.distance().au, sun_astrometric.distance().km

i_annotate = [0, 4, 9, 14, 19, 24, 29]

annots = [[str(val) for val in thing[i_annotate].round(n)]
          for (thing, n) in zip(both, (9, 1))]

annots = np.array(annots)

fig, axes = plt.subplots(2, 1)

goodies = axes, both, ('AU', 'km'), annots

for ax, distance, label, anns in zip(*goodies):
    ax.plot(days, distance)
    for ann, day, dist in zip(anns, days[i_annotate], distance[i_annotate]):
        ax.annotate(ann, (day, dist))
        ax.plot(day, dist, 'ok')
    ax.set_ylabel(label, fontsize=12)

axes[1].set_xlabel('days in May 2023', fontsize=12)

suptitle = ('distance from Bangalore ' + str(latlon) +
            ' to the Sun May 2023 (00:00)')

plt.suptitle(suptitle)

fig.subplots_adjust(left=0.13, right=0.86)
             
plt.show()
Source Link
uhoh
  • 151k
  • 56
  • 505
  • 1.6k

Without all the details and especially without the output included in the question, it's hard to say for sure that you've done things exactly correctly.

However I think you're certainly close!

This Python script uses the Skyfield package and the DE421 Development Ephemeris While JPL's Horizons doesn't use exactly this same ephemeris, results will be very very close.

On May 1st 2023, with Bangalore at 12.979N, 77.592E I get a distance to the Sun of 1.007313284 AU or 150691922.3 km. You will get slightly different numbers if you used a slightly different lat/long, or if you didn't include the light-time correction that the .observe() method uses here.

distance from Bangalore to the Sun in May 2023 using Skyfield

from skyfield.api import Loader, Topos
import numpy as np
import matplotlib.pyplot as plt

load = Loader('~/Documents/fishing/SkyData') # avoid multiple copies of large files
ts = load.timescale()
eph = load('de421.bsp')

earth, sun, moon = [eph[x] for x in ('earth', 'sun', 'moon')]

latlon = 12.979, 77.592
bangalore = Topos(latitude_degrees = latlon[0],
                  longitude_degrees = latlon[1])

days = np.arange(1, 31)

times = ts.utc(2023, 5, days, 0, 0, 0) # 2023-05-01 00:00-2023-05-30 00:00

sun_astrometric = (earth + bangalore).at(times).observe(sun)

both = sun_astrometric.distance().au, sun_astrometric.distance().km

i_annotate = [0, 4, 9, 14, 19, 24, 29]

annots = [[str(val) for val in thing[i_annotate].round(n)]
          for (thing, n) in zip(both, (9, 1))]

annots = np.array(annots)

fig, axes = plt.subplots(2, 1)

goodies = axes, both, ('AU', 'km'), annots

for ax, distance, label, anns in zip(*goodies):
    ax.plot(days, distance)
    for ann, day, dist in zip(anns, days[i_annotate], distance[i_annotate]):
        ax.annotate(ann, (day, dist))
        ax.plot(day, dist, 'ok')
    ax.set_ylabel(label, fontsize=12)

axes[1].set_xlabel('days in May 2023', fontsize=12)

suptitle = ('distance from Bangalore (' + str(latlon) +
            ' to the Sun May 2023 (00:00)')

plt.suptitle(suptitle)

fig.subplots_adjust(left=0.13, right=0.86)
             
plt.show()