16
$\begingroup$

I'm looking for information on atmospheric density in Earth orbit. All the atmospheric density tables and graphs I've found go no higher than 100 km. Definitions like the US Standard Atmosphere don't go higher than 250k ft.

I'm interested in the rest of the graph, all the way to density =0 (or as low as it gets in interplanetary space). This sits occasionally gets questions about e.g. drag on a satellite, and I've never found a good source, just rules of thumb (drag is significant in LEO, but not an issue in GEO).

I realize atmospheric density fluctuates, I'd be happy with an average value or even better, a bandwidth indication (max. and min. values).
$\endgroup$
7
  • 2
    $\begingroup$ Me too! I think that there was a Japanese proposal for "low-flying" cubesats for Earth imaging, I think it was in the 100 to 150 km ballpark which allows the same diffraction-limited resolution figure of a 3 or 4X larger diameter aperture in a reasonable LEO. The proposal called for continuous electric propulsion for altitude maintenance against drag. I'll try to look for it - it seems it would have a discussion of the variability/unpredictability of the density at those heights due to solar behavior. $\endgroup$
    – uhoh
    Commented Sep 15, 2016 at 13:23
  • 1
    $\begingroup$ Maybe useful: grc.nasa.gov/www/k-12/rocket/atmos.html $\endgroup$
    – Steve
    Commented Sep 15, 2016 at 14:03
  • 1
    $\begingroup$ I assume you asked this here rather than the Earth Sciences SE because you are interested in modeling drag on a launch vehicle, an orbiting vehicle, or a reentry vehicle. Modeling the upper atmosphere is very hard and rather imprecise; the best models are lucky to attain one significant digit of accuracy in density and composition. Using a mean value is rather meaningless because the fluctuations are so large: A factor of two or so between day side and night side, a factor of two or so shortly after a large geomagnetic storm, and a factor of ten over the course of the solar cycle. $\endgroup$ Commented Sep 16, 2016 at 18:16
  • $\begingroup$ TildalWave's answer to a question on why satellites deorbit has a graph going up to 300 km and a link to the source document, which discusses an algorithm developed to calculate atmospheric density in LEO and has many other useful graphs and tables. $\endgroup$
    – kim holder
    Commented Sep 17, 2016 at 14:16
  • 1
    $\begingroup$ @uhoh Sorry for resurrecting this comment chain, but you may be interested in SLATS (Tsubame), which launched last year (SSN # 43066) $\endgroup$
    – costrom
    Commented Nov 15, 2018 at 14:48

4 Answers 4

15
$\begingroup$

In the Shuttle Mission Simulator we used the Jacchia Reference Atmosphere, it's good to 2500 km. IIRC it's not good low down so we used a standard atmosphere model for atmospheric flight regimes and Jacchia above 182 km (600K feet).

$\endgroup$
3
  • 1
    $\begingroup$ That's great! Several other things at the US Standard Atmosphere and related models page linked there as well. $\endgroup$
    – uhoh
    Commented Jan 16, 2017 at 18:05
  • 4
    $\begingroup$ JB2008 is the modern version of that. Also EarthGRAM incorporates JB2008 as well as another selectable high-altitude model, smoothly interpolated to other lower-altitude models, and including uncertainties. If you want an end-to-end atmosphere model, you should use EarthGRAM. $\endgroup$
    – Mark Adler
    Commented Jan 16, 2017 at 19:08
  • 1
    $\begingroup$ It is not recent, but for some quick, tabulated pressure and density data from the 1976 model, see Part 4, Main Tables, p49+ ntrs.nasa.gov/archive/nasa/casi.ntrs.nasa.gov/19770009539.pdf $\endgroup$
    – uhoh
    Commented Feb 3, 2017 at 13:35
9
$\begingroup$

We recently had a similar requirement and created a RESTful web API that wraps the original code of the NRLMSISE00 and the JB2008 models. The API is open and available here for anyone who needs it.

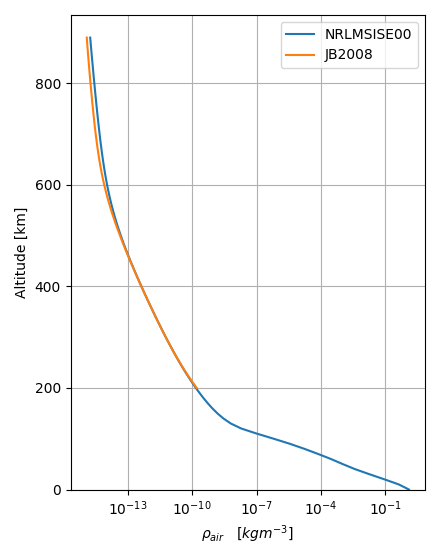
Edit: the following is a graph that plots the variation of atmospheric density with altitude, as calculated by both JB2008 and NRLMSISE00 models accessed using the API. Note that calculated values will vary significant with solar activity and these values are for nominal parameters. You can review and run the Python code used to generate the plot here

enter image description here

$\endgroup$
0
3
$\begingroup$

As a rough estimate, you can use

$\frac{P}{P_0}=e^{-y/h},$

where $P$ is the pressure, $P_0$ is the pressure at some reference height such as sea level, $y$ is the height above that reference, and $h$, called the scale height, is about 8000 meters. This expression basically follows from thermodynamics (equipartition). It's exactly correct if the gravitational field is constant and the atmosphere is in thermal equilibrium. In reality, the atmosphere is not in thermal equilibrium, and it gets colder as you go higher.

Since this is an exponential, it falls off very rapidly. You don't have to go very high before it becomes totally negligible, and the dominant component will not be the earth's atmosphere but the interplanetary medium.

$\endgroup$
4
  • $\begingroup$ The question is about density, not pressure. They are related by something called temperature, which varies substantially in the altitudes discussed in the question, not only by altitude, but by time as solar activity has a substantial effect. $\endgroup$
    – uhoh
    Commented Oct 1, 2016 at 22:55
  • $\begingroup$ ...and at 400km the ISS must regularly fire engines to regain altitude, and missions from the Earth must regularly resupply the ISS with fresh propellant. It looses about 100 meters per day of altitude, depending on the current solar activity. I wish you'd adjust the "You don't have to go very high before it becomes totally negligible" wording a bit. See this and this and this answer for example. It will give me a chance to change from down to upvote too $\endgroup$
    – uhoh
    Commented Jan 16, 2017 at 16:21
  • 1
    $\begingroup$ An exponential is a very poor approximation for those altitudes. $\endgroup$
    – Mark Adler
    Commented Jan 16, 2017 at 18:59
  • 1
    $\begingroup$ Only at about 1000km it becomes sufficiently "negligible" for solar sail to operate on light pressure instead of acting as a giant parachute. $\endgroup$
    – SF.
    Commented Jan 16, 2017 at 19:54
2
$\begingroup$

The ISS needs about 7 tons of fuel per year to hold orbit. I just tried to calculate the air density in the 400 km orbit with the scale height 8.5 km.

Air density there should be $\frac{1}{e^\frac{400}{8.5}} $compared to the sea level. But this seems far too thin, because at this calculated air density there would be too little air to cause 7 tons fuel usage to hold orbit.

In the mean time: Scale height depends in temperature. So above 100 km, use 24 km instead of 8,5 km. So I repeated the calculation with scale height 8,5 up to 100 km and scale height 24 from 100 to 420 km. This I multiplied with 7691 m/sec, 86400 sec a day, 365 days a year gives about 3. The result means 1 m² ISS hits each year as much air as 3 m³ at sea level. This matches good the fuel usage to hold orbit.

$\endgroup$
2
  • 2
    $\begingroup$ Welcome to Space! Could you show us which formula you used for your calculation? $\endgroup$
    – DrSheldon
    Commented Nov 13, 2018 at 18:30
  • $\begingroup$ Hi @RolandMösl this is more of a comment than a direct answer to the question. Stack Exchange works a little different than other sites you may have used. Like the other comment suggests, can you either make this more of a complete answer to the question, and include more details how you reached your conclusion, or consider instead posting a new question (which don't require as much support). Once you reach 50 reputation points, you can post comments on other people's posts. It doesn't take long to get there. $\endgroup$
    – uhoh
    Commented Nov 14, 2018 at 1:29

Your Answer

By clicking “Post Your Answer”, you agree to our terms of service and acknowledge you have read our privacy policy.

Not the answer you're looking for? Browse other questions tagged or ask your own question.