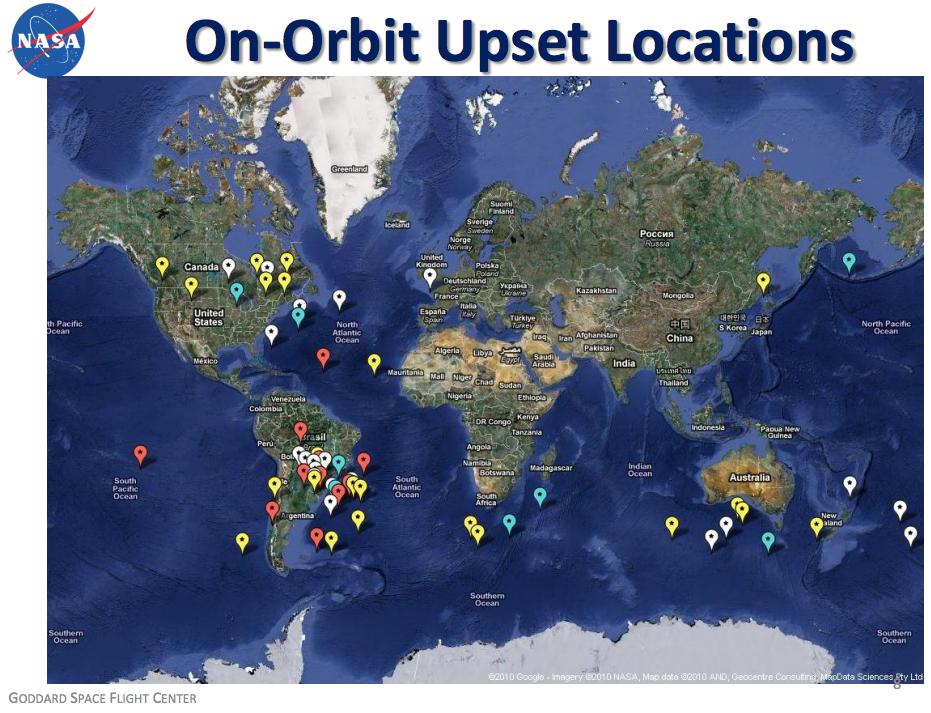
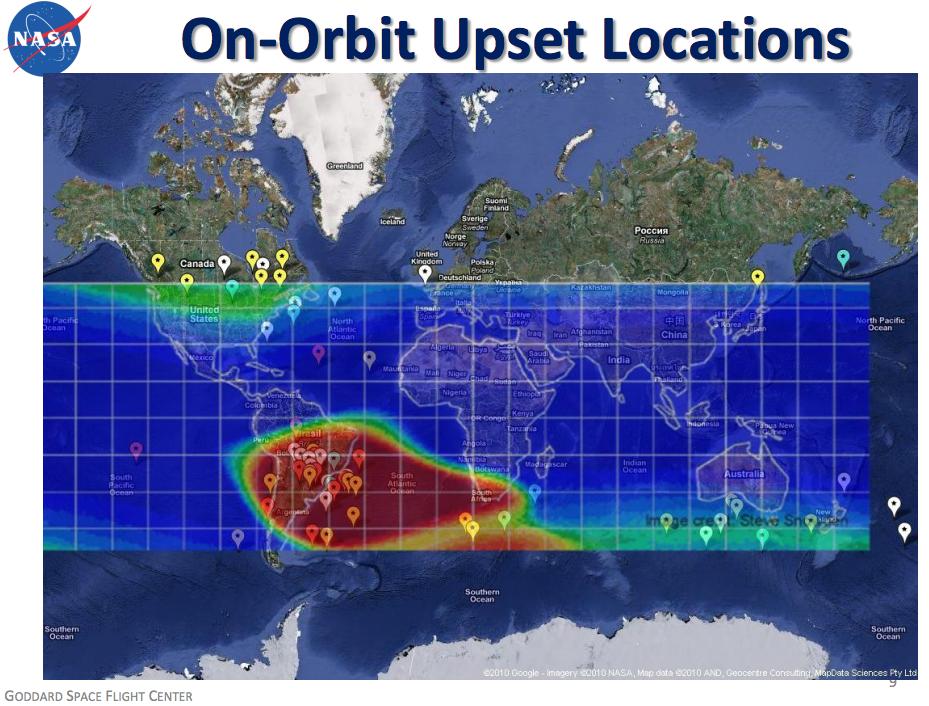
I was reading about the Advanced Hybrid On-Board Science Data Processor - SpaceCube 2.0 Space Cube 2.0 and I saw maps of computer upsets in orbit recorded by Space Cube 1.0 on slides 8 and 9. What is going on near South America, why so many upsets there? What's the physics behind the phenomenon?
-
3$\begingroup$ en.wikipedia.org/wiki/South_Atlantic_Anomaly $\endgroup$– pericynthionCommented Mar 1, 2017 at 0:02
-
$\begingroup$ somewhat related in Astronomy SE: Why wasn't CHEOPS data taken during passage through the South Atlantic Anomaly downlinked in this case, resulting in gaps in photometry? $\endgroup$– uhohCommented Jan 26, 2021 at 1:37
2 Answers
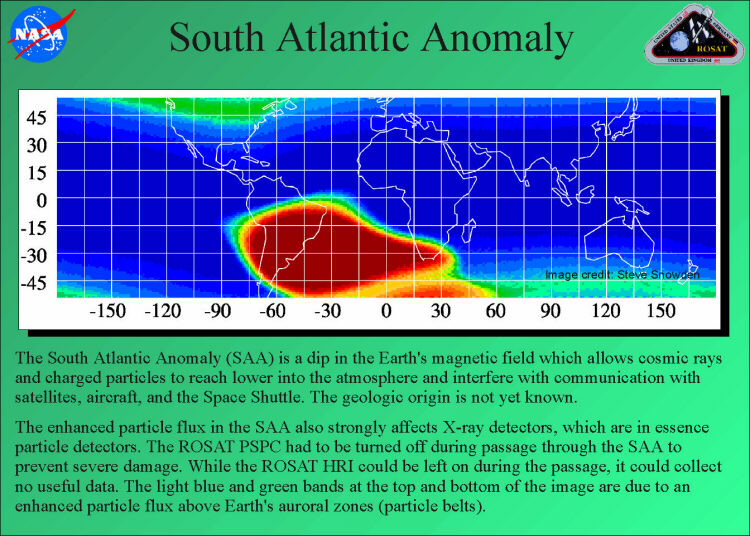
The lower map appears to show the South Atlantic Anomaly (SAA), an area where the inner Van Allen radiation belt comes closest to the surface of the Earth.
From the linked article:
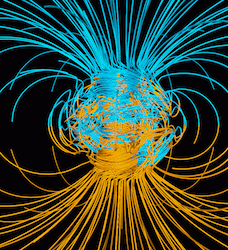
The effect is caused by the non-concentricity of the Earth and its magnetic dipole. The SAA is the near-Earth region where the Earth's magnetic field is weakest relative to an idealized Earth-centered dipole field.
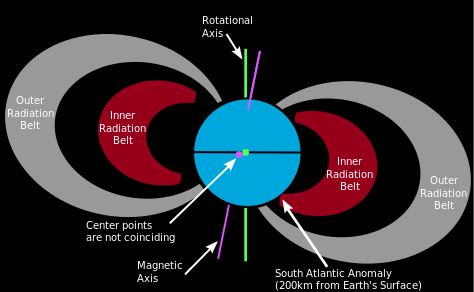
The article gives a good side view showing the asymmetry:
Orbiting objects that pass through the SAA are subject to increased radiation flux compared to other portions of their orbit.
Edit: Here's a picture from my personal collection showing the instructor station of the Shuttle Mission Simulator (from long ago). On the far wall you can see a framed copy of a paper groundtrack map, with the South Atlantic Anomaly marked on it in gray. Wish I had a closeup! But you can see there is no North Atlantic Anomaly.
-
1$\begingroup$ "Go read Wikipedia" could be a valid comment, but not an answer. I felt a nice tidy answer including why a dip in the field "mysteriously attracts" the VanAllen belt would be important for future readers, thus I included "What's the physics behind the phenomenon?" in the original question. $\endgroup$– uhohCommented Mar 1, 2017 at 2:11
-
1$\begingroup$ Go for it! I look fwd to reading and upvoting it! $\endgroup$ Commented Mar 1, 2017 at 3:15
-
1$\begingroup$ I think the tilt of the purple axis means that the Northern lobe doesn't come as close to the surface of the Earth. I've never heard of a North Atlantic Anomaly (the SAA was marked on all our NASA tracking maps, back when they were paper). I will edit the question to add this. $\endgroup$ Commented Mar 2, 2017 at 0:29
-
3$\begingroup$ @Puffin one issue is that Earth's real field could be said to be a lumpy dipole. If you mathematically express the real, lumpy field as a tilted and off-center dipole, it will do it's best to try to fit the SAA. But that's just a simple model. The real SAA is more narrowly localized than the off-center dipole could show, and it's better to use a much larger expansion in spherical harmonics (also a model) traditionally centered on the Earth's center. Earth's near-surface magnetic field is produced by a complicated real-world jumble of currents and fields deep inside the planet. $\endgroup$– uhohCommented Mar 3, 2017 at 0:33
-
2$\begingroup$ @Puffin We get exposed to pictures like this i.sstatic.net/Sl7N1.gif from a very early age, whereas we should be thinking more like this: i.sstatic.net/Nk2rn.gif To answer your comment directly - once the simple off-center dipole model is used, one of the four lobe-ends can approach closer to the Earth than the other three in this 2D (mis)representation. Actually that's precisely why this (fudged) explanation is invoked. In that 2D pic, the sums of lobe-to-surface distances of opposite pairs are still approximately equal. $\endgroup$– uhohCommented Mar 3, 2017 at 0:43
I'm a little late but I've been meaning to add this as a supplement to @OrganicMarble's answer.
Just like the Earth's gravity field, it's magnetic field is lumpy. But the lumpiness shows up differently.
For Earth's gravity field we start with the monopole field or central attraction. The Earth doesn't have a dipole gravity field because that's zeroed out by definition of where the center is. The first correction is the axisymmetric quadrupole field caused by Earth's oblateness caused by Earths' rotation and expresses as J2.
This is well aligned to Earth's equator because it's produced by rotation.
For Earth's magnetic field there is of course no monopole field and the first term is the dipole field. But since there is so much intellectual inertia invested in the idea that the Earth's field is a dipole, instead of talking about higher order terms it's easier to capture the deviation or "main lumpiness" by saying that the dipole is not in the center of the Earth and it's tilted by about 11.5 degrees.
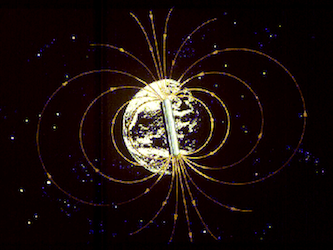
Dipole thinking (left, Source) versus what it is (right, Source)
Did I mention cyclotron radius?
Particles are trapped in the van Allen radiation belts because their low energy keeps them there. As the cycle in helical orbits around the field lines, they reach a north and south extreme where their cyclotron radius based on their energy prevents them from traveling further; all velocity needs to be perpendicular to the field lines. At this point they "mirror" or reflect back and go the other way to put things loosely.
When the field is weak, that mirror or reflection point moves closer to the Earth's surface, as low as about 200 km some times, and that sends the ISS at its nominal 400 km orbit straight through the tail of the inner van Allen belt when it passes through the South Atlantic Anomaly.
@OrganicMarble's answer includes the image below, where you see the "toe" of the inner Van Allen radiation belt on the right side getting close to the Earth.
If you just plot a dipole field tilted and offset by 500 kilometers, you can reproduce the "weak spot" in Earths' field qualitatively. The real anomaly seems to have a different shape and sharper transition, and that's because the dipole model is simply not a good approximation to begin with. It is what it is.
below: plot of an estimate of the field strength of the Earth in LEO based on 11.5 degree inclination and a 500 km offset of Earth's dipole, for latitudes between 50N and 50S; Python.
below: plot of South Atlantic Anomaly an increase in radiation which is correlated with areas of lowest magnetic field strength.
The two plots should not be compared directly as they show very different things.
-
$\begingroup$ @Chris yikes!! Okay I'll get right on it. I'd forgotten about all of that. $\endgroup$– uhohCommented Mar 8, 2019 at 13:46
-
