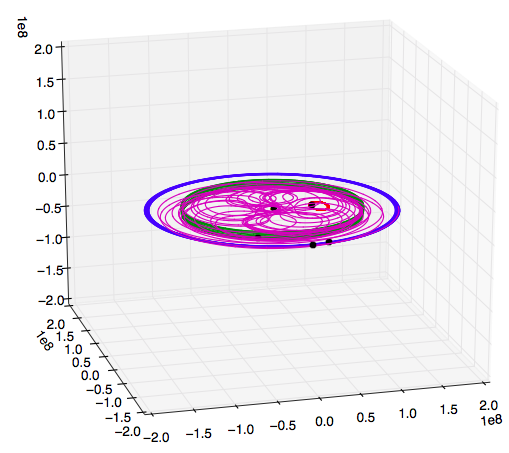
In the question Is the Parker Solar Probe's semimajor axis being so close to that of Mercury's just coincidence? Does it help somehow? I used a Python script to plot the heliocentric orbit of the Parker Solar Probe in a frame rotating with Mercury's mean anomaly.
To do this I manually downloaded state vectors from Horizons as text files and then imported them, decoded the format, and converted to numpy arrays for simple processing and plotting.
Could someone show a specific example of how to get those state vectors into a numpy array using astroquery.jplhorizons? I've just learned in this answer of this package's existence.
This way I can just use np.save() or some other method to save the data for future, faster plotting or analysis.
Specifically, the data should be defined as follows:
start  2018-Aug-13 00:00:00
stop   2025-Aug-31 00:00:00
step   1 hour
Solar System Barycenter
Ecliptic and Mean Equinox of Reference
km and km/sec
csv format
x, y, z, vx, vy, vz (state vectors)
Objects: Sun, Mercury, Venus, Earth Geocenter, Parker Solar Probe
def makecubelimits(axis, centers=None, hw=None):
    lims = ax.get_xlim(), ax.get_ylim(), ax.get_zlim()
    if centers == None:
        centers = [0.5*sum(pair) for pair in lims]

    if hw == None:
        widths  = [pair[1] - pair[0] for pair in lims]
        hw      = 0.5*max(widths)
        ax.set_xlim(centers[0]-hw, centers[0]+hw)
        ax.set_ylim(centers[1]-hw, centers[1]+hw)
        ax.set_zlim(centers[2]-hw, centers[2]+hw)
        print "hw was None so set to:", hw
    else:
        try:
            hwx, hwy, hwz = hw
            print "ok hw requested: ", hwx, hwy, hwz

            ax.set_xlim(centers[0]-hwx, centers[0]+hwx)
            ax.set_ylim(centers[1]-hwy, centers[1]+hwy)
            ax.set_zlim(centers[2]-hwz, centers[2]+hwz)
        except:
            print "nope hw requested: ", hw
            ax.set_xlim(centers[0]-hw, centers[0]+hw)
            ax.set_ylim(centers[1]-hw, centers[1]+hw)
            ax.set_zlim(centers[2]-hw, centers[2]+hw)

    return centers, hw

class Thing(object):
    def __init__(self, name):
        self.name = name

def rotate_it(vec, theta):
    cth, sth = [f(theta) for f in (np.cos, np.sin)]
    x, y, z = vec
    xr = cth*x - sth*y
    yr = cth*y + sth*x
    return np.vstack((xr, yr, z))

import numpy as np
import matplotlib.pyplot as plt
from mpl_toolkits.mplot3d import Axes3D

fnames = ['Parker Solar Probe Sun 1h horizons_results.txt',
          'Parker Solar Probe Mercury 1h horizons_results.txt',
          'Parker Solar Probe Venus 1h horizons_results.txt',
          'Parker Solar Probe Earth 1h horizons_results.txt',
          'Parker Solar Probe Spacecraft 1h horizons_results.txt']

names  = ['Sun', 'Mercury', 'Venus', 'Earth', 'Parker']

halfpi, pi, twopi = [f*np.pi for f in [0.5, 1.0, 2.0]]
degs, rads        = 180./pi, pi/180.
AU                = 149597870.700  # kilometers

things = []
JDs, posns, vels, linez = [], [], [], []
for name, fname in zip(names, fnames):
    with open(fname, 'r') as infile:

        lines = infile.read().splitlines()

    iSOE = [i for i, line in enumerate(lines) if "$$SOE" in line][0]
    iEOE = [i for i, line in enumerate(lines) if "$$EOE" in line][0]

    print iSOE, iEOE, lines[iSOE], lines[iEOE]

    lines = [line.split(',') for line in lines[iSOE+1:iEOE]]
    JD  = np.array([float(line[0]) for line in lines])
    pos = np.array([[float(item) for item in line[2:5]] for line in lines])
    vel = np.array([[float(item) for item in line[5:8]] for line in lines])

    pos, vel = [thing.T for thing in pos, vel]

    thing = Thing(name)
    things.append(thing)
    thing.JD    = JD
    thing.pos   = pos
    thing.vel   = vel
    thing.lines = lines

Sun, Mercury, Venus, Earth, Parker = things

theta_M = np.arctan2(Mercury.pos[1], Mercury.pos[0])
theta_P = np.arctan2(Parker.pos[1],  Parker.pos[0] )

T_mercury = 87.969 * 24. # hours
JDx  = 2459597.5
iJDx = 30096
theta_x0  = theta_M[iJDx]
hours_x   = np.arange(len(theta_M), dtype=float) - iJDx
theta_Mx  = theta_x0 + twopi * hours_x / T_mercury

for thing in things:
    thing.pos_rM = rotate_it(thing.pos, -theta_M)
    thing.vel_rM = rotate_it(thing.vel, -theta_M)

    thing.pos_rMx = rotate_it(thing.pos, -theta_Mx)
    thing.vel_rMx = rotate_it(thing.vel, -theta_Mx)

    thing.pos_rP = rotate_it(thing.pos, -theta_P)
    thing.vel_rP = rotate_it(thing.vel, -theta_P)

JD_today      = 2458360.5 # 2018-Aug-30
i_today       = np.argmax(Earth.JD >= JD_today)
i_08_Nov_2024 = np.argmax(Earth.JD >= 2460622.5)

colors = '-y', '-r', '-g', '-b', '-m'

if True:
    fig = plt.figure()  # [12, 10]
    ax1 = fig.add_subplot(2, 1, 1)
    for thing, co in zip(things, colors):
        x, y, z = thing.pos_rMx
        ax1.plot(x, y, co)
        if True:
            ax1.plot(x[i_today:i_today+1],
                     y[i_today:i_today+1], 'ok', markersize=8)
    ax1.set_xlim(-1.6E+08, 1.6E+08)
    ax1.set_ylim(-1.6E+08, 1.6E+08)

    ax2  = fig.add_subplot(2, 1, 2)
    i_start = i_08_Nov_2024
    for thing, co in zip(things, colors):
        x, y, z = thing.pos_rMx[:, i_start:]
        ax2.plot(x, y, co)
        if False:
            ax2.plot(x[i_today:i_today+1],
                     y[i_today:i_today+1], 'ok', markersize=8)
    ax2.set_xlim(-1.6E+08, 1.6E+08)
    ax2.set_ylim(-1.6E+08, 1.6E+08)
    plt.show()

if True:
    fig = plt.figure(figsize=[10, 8])  # [12, 10]
    ax  = fig.add_subplot(1, 1, 1, projection='3d')
    for thing, co in zip(things, colors):
        x, y, z = thing.pos_rM
        ax.plot(x, y, z, co)
        ax.plot(x[i_today:i_today+1],
                y[i_today:i_today+1],
                z[i_today:i_today+1], 'ok')

    c, h = makecubelimits(ax, centers=(0, 0, 0), hw=None)
    print c, h

    plt.show()

