10
$\begingroup$

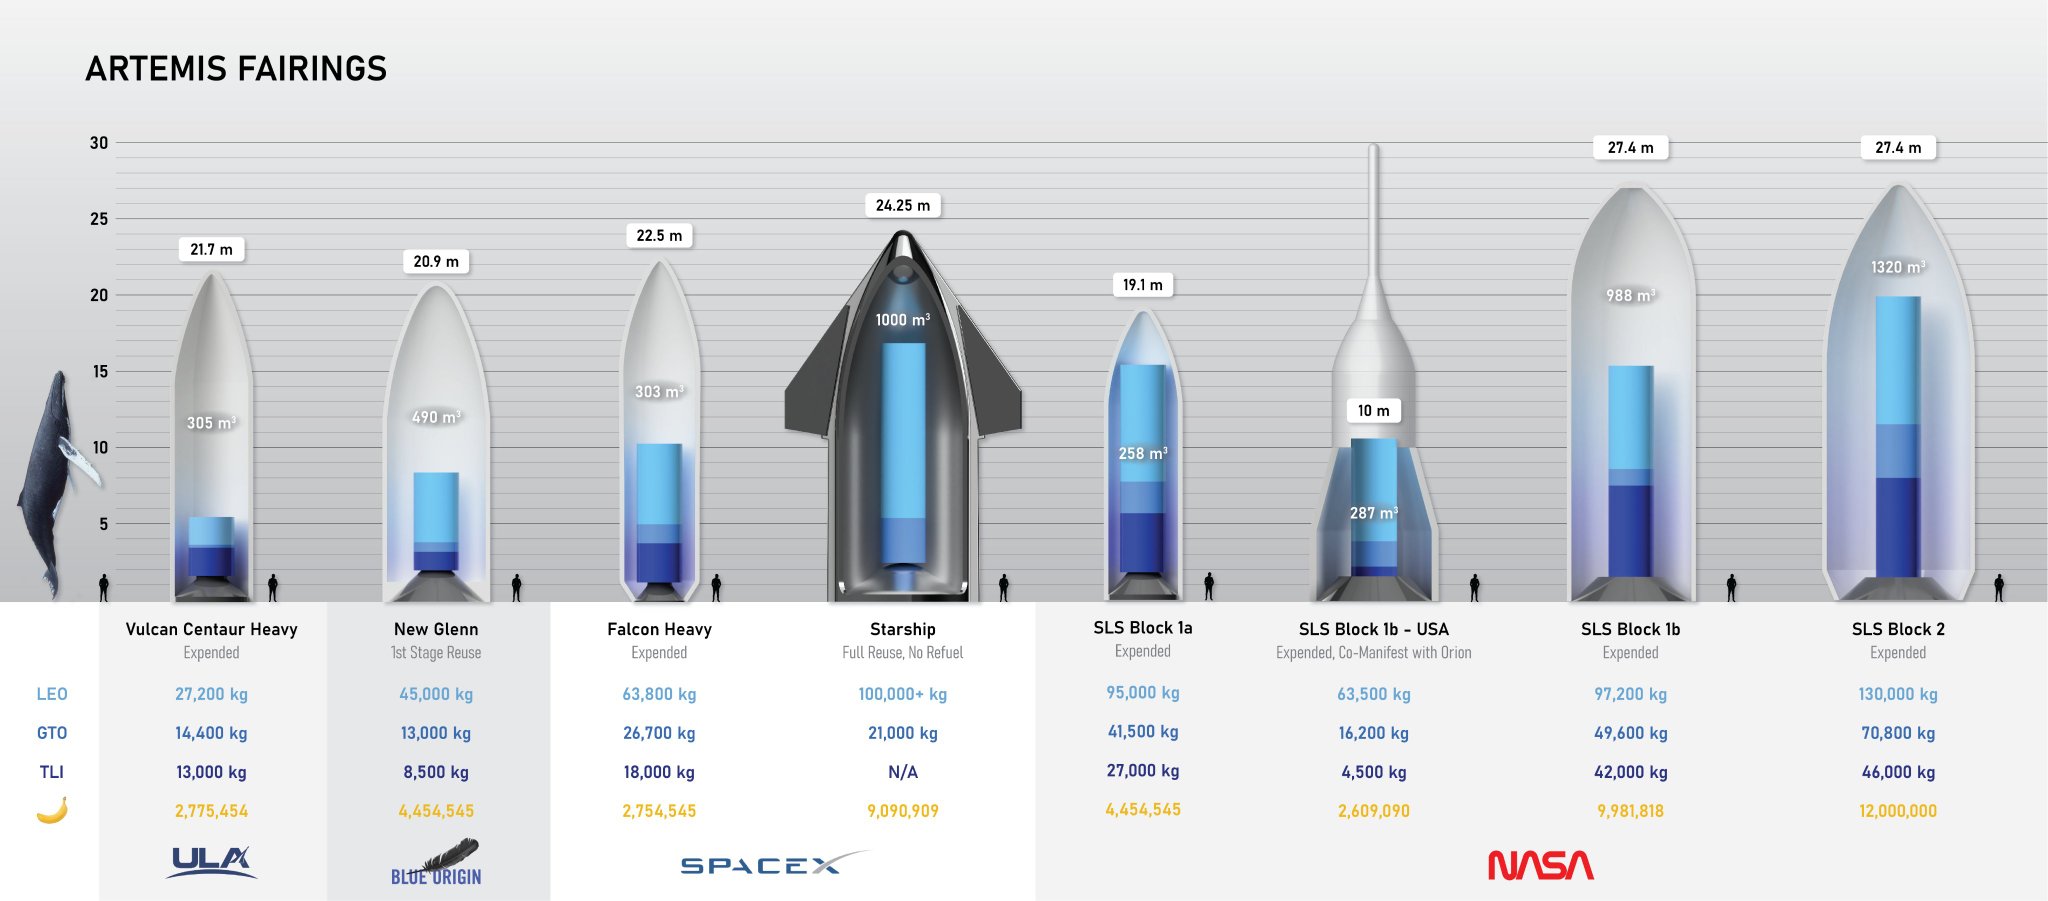
@FreddieR's answer to What are the longest current rocket payload fairings, capable of carrying long space station sections? contains the following graphic. It's attributed to Ken Kirtland and I found a copy in DBS Larssson's tweeted graphic of LEO, GTO and TLI payload capabilities for heavy haul launch vehicles (shown below).

Eight vehicle/configuration combinations are shown and for each there are four numerical values. The first are payload mass capabilities to LEO, GTO and TLI in kilograms, but the last is labeled with a picture of a banana and the numbers are (accordingly) in yellow. No units are shown and the banana values range from 2.6 to 12 million.

It's interesting to note that the banana values generally have repeating digits, which may (or may not) be a clue.

Question: What do the banana values mean in this tweeted plot of heavy lift vehicle capabilities?


DBS Larssson's tweeted graphic of LEO, GTO and TLI payload capabilities for heavy haul launch vehicles https://twitter.com/dbslarsson/status/1304566200760807424?lang=en

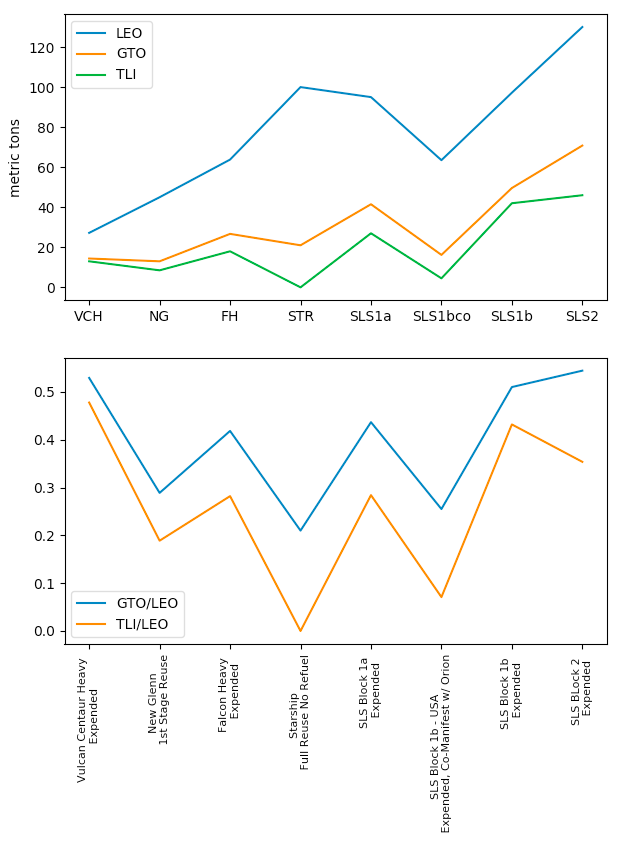
I've typed out the values here (and plotted below)

Vehicle, configuration and use      LEO    GTO    TLI    bananas
---------------------------------  -----  -----  -----  ---------
Vulcan Centaur Heavy \n Expended    27.2   14.4   13     2775454
New Glenn \n 1st Stage Reuse        45     13      8.5   4454545
Falcon Heavy \n Expended            63.8   26.7   18     2754545
Starship \n Full Reuse No Refuel   100     21     n/a    9090909
SLS Block 1a \n Expended            95     41.5   27     4454545
SLS Block 1b - USA \n 
   Expended, Co-Manifest w/ Orion   63.5   16.2    4.5   2609090
SLS Block 1b \n Expended            97.2   49.6   42     9981818
SLS BLock 2 \n Expended            130     70.8   46    12000000

From this answer to Is there a formula for converting a rocket's performance for one orbit to another? E.g. SSO performance to GSO?:

plotting of tweeted LEO, GTO and TLI data for heavy lift vehicles

import numpy as np
import matplotlib.pyplot as plt

info = (('Vulcan Centaur Heavy \n Expended', 27.2, 14.4, 13, 2775454),
        ('New Glenn \n 1st Stage Reuse', 45, 13, 8.5, 4454545),
        ('Falcon Heavy \n Expended', 63.8, 26.7, 18, 2754545),
        ('Starship \n Full Reuse No Refuel', 100, 21, 0, 9090909),
        ('SLS Block 1a \n Expended', 95, 41.5, 27, 4454545),
        ('SLS Block 1b - USA \n Expended, Co-Manifest w/ Orion', 63.5, 16.2, 4.5, 2609090),
        ('SLS Block 1b \n Expended', 97.2, 49.6, 42, 9981818),
        ('SLS BLock 2 \n Expended', 130, 70.8, 46, 12000000))

data = np.array([line[1:-1] for line in info])
names = [''] + [line[0] for line in info]
nicknames = '', 'VCH', 'NG', 'FH', 'STR', 'SLS1a', 'SLS1bco', 'SLS1b', 'SLS2'
labels = 'LEO', 'GTO', 'TLI'
LEO, GTO, TLI = data.T
TLI_to_LEO = TLI/LEO
GTO_to_LEO = GTO/LEO

if True:
    fig, (ax1, ax2) = plt.subplots(2, 1, figsize=[7, 10])
    for thing, label in zip(data.T, labels):
        ax1.plot(thing, label=label)
    ax1.legend()
    ax1.set_xticklabels(nicknames)
    ax1.set_ylabel('metric tons', fontsize=10)
    ax2.plot(GTO_to_LEO, label='GTO/LEO')
    ax2.plot(TLI_to_LEO, label='TLI/LEO')
    ax2.set_xticklabels(names, rotation = 90, fontsize=8)
    ax2.legend(loc='best')
    plt.subplots_adjust(left=None, bottom=0.35, right=None, top=0.98,
                        wspace=None, hspace=None)

    plt.show()
$\endgroup$
6

2 Answers 2

13
$\begingroup$

For most of the vehicles there seems to be a correlation between size and "banana number", which is not yet a SI-recognized unit of measure (And I really hope they don't decide to keep a reference banana in a vault in France along with the now disused kilogram).

Looking at the numbers, the repeating digits of "54", "45", "09" strongly suggest a mathematical conversion involving a factor of $\frac{1}{11}$ in the process. Applying this to the Vulcan number gives us 30529998 - precisely the volume in centiliter - or cubic meter multiplied by 100,000.

$$\rm{Bananas} = \rm{Volume} / 11 \cdot 100000$$

There are two numbers that don't fit:

  • For SLS Block 1b, the first digit is wrong and should be a 8 instead of 9.
  • For SLS Block 1A, the number is a plain copy of that of New Glen and should read 2345454 instead.

If that implies that the average banana has a volume of about 91 ml - unlikely. What I'd call a fairly normal banana (sample size 1 from my fruit basket) has a weight of 160 g and barely floats, so has a volume of close to 200 ml.

$\endgroup$
10
3
$\begingroup$

Since the banana-for-scale row isn't given separately for LEO, GTO, TLI, I think is is something which is mission / trajectory / orbit invariant.

My guess it that it is volume (or equivalently number of identical volume & density bananas) since the ones with larger diameters show significantly higher values (volume grows as square of radius).

The internal volumes are given in the figure. The ratio of internal volumes and ratio of banana seem the same. So the bananas probably represent mass or volume. The vulcan centaur heavy is used for the normalisation.

There are at least two values which do not agree. They are shown in bold. But the bananas for the New Glen and SLS are identical, it could be possible that the author of the Graphic done messed up.

ratio

volume  ratio     banana    ratio     Ratio difference
305     1.000     2775454   1.000     0 (by definition)
490     1.607     4454545   1.605     -1.5785E-03
303     0.993     2754545   0.992     -9.7617E-04
1000    3.279     9090909   3.275     -3.2212E-03
258     0.846     4454545   1.605     7.5908E-01
287     0.941     2609090   0.940     -9.2479E-04
988     3.239     9981818   3.596     3.5712E-01
1320    4.328     12000000  4.324     -4.2519E-03
$\endgroup$
11
  • 1
    $\begingroup$ We have a veriety of bananas where i live. So I dont' know the standard banana used by the author of the graphic. If there was a standard the actual numbers could be verified instead of the ratios. $\endgroup$
    – AJN
    Commented May 30, 2021 at 8:02
  • 1
    $\begingroup$ In six of the eight cases it's better than 1%, and in the two cases where it's not it's way way off, which leads me to believe that your explanation is correct but incomplete and there was simply a second criteria that allowed them to stuff 76% and 36% more bananas in than the printed volume would suggest. Perhaps a different fairing was used for the banana calculation than what's displayed in the image, or perhaps (even simpler) the volumes are wrong in those two cases. $\endgroup$
    – uhoh
    Commented May 30, 2021 at 9:04
  • 1
    $\begingroup$ Somebody who has twitter should ask the fellow who tweeted this graphic. I need closure! $\endgroup$
    – AJN
    Commented May 30, 2021 at 9:07
  • 1
    $\begingroup$ @uhoh Number 6 has Orion on top, not counting to the volume. $\endgroup$
    – asdfex
    Commented May 30, 2021 at 9:09
  • 1
    $\begingroup$ Oh I see what you mean; the banana value of the 1a is the same as that for the New Glen. We need to trend a hash tag or something: #wrongfairingbananas pehaps? :-) $\endgroup$
    – uhoh
    Commented May 30, 2021 at 9:12

Your Answer

By clicking “Post Your Answer”, you agree to our terms of service and acknowledge you have read our privacy policy.

Not the answer you're looking for? Browse other questions tagged or ask your own question.