6
$\begingroup$

According to st. Robert's Law, propellant burn rates increase with pressure. When an SRB is ignited, propellant starts to burn, making the pressure rise in the combustion chamber. The flow through the nozzle transitions from subsonic to sonic and becomes choked. At this point, increasing pressure only increases the structural load on the combustion chamber walls without any performance gains. No more mass flow can be achieved, but nothing keeps more (gaseous) mass from being injected due to burning.

As the burn rate never drops with pressure, at best it plateaus, it would seem to be that the burn rate and combustion chamber pressure would interact in a positive feedback loop, ever-increasing the pressure until destruction.

Where am I going wrong? What keeps the burning / the pressure stable once choked flow is achieved?


The only thing I found online so far is the image below (source). This however, seems to assume the flow at the nozzle is not choked. When choked flow is to be reached, I assume the orange curve would reach a maximum and would stay constant at increased pressure. The entire curve would have to lie below the burn rate curve, again leading to a positive feedback loop.

2

The best explanation I can come up with is the situation shown below. In the second equilibrium point, choked flow is reached and the burn rate is stable, I guess. Is this how SRB's work? If so, how is the first equilibrium point overcome? Also, if operating in the second equilibrium point and whatever disturbance kicks up the pressure a bit, what is the mechanism driving it back?

My assumption for choked flow SRB operation

$\endgroup$
5
  • $\begingroup$ Aha, that's why super high chamber pressures still make sense. Thanks for the info! $\endgroup$
    – eds1999
    Commented Dec 13, 2021 at 13:22
  • $\begingroup$ Could you explain how the nozzle mass flow curve should look instead, and where it should meet the burn rate mass flow curve? $\endgroup$
    – eds1999
    Commented Dec 13, 2021 at 13:31
  • $\begingroup$ @CuteKItty_pleaseStopBArking you should post that as an answer. $\endgroup$ Commented Dec 13, 2021 at 17:14
  • $\begingroup$ @CuteKItty_pleaseStopBArking I just meant I would upvote it $\endgroup$ Commented Dec 13, 2021 at 17:34
  • 1
    $\begingroup$ Saint Robert’s “Law” is not a physical law like Boyle’s law. It is a mathematically convenient way of generating exponential curves. Experimental pressure/burn rate diagrams are much messier. Plateauing or mesa propellants, for instance, cannot be approximated with Saint Robert’s Law except over small ranges of pressure. $\endgroup$
    – Woody
    Commented Dec 13, 2021 at 18:59

1 Answer 1

6
$\begingroup$

No more mass flow can be achieved, but nothing keeps more (gaseous) mass from being injected due to burning.

This however, seems to assume the flow at the nozzle is not choked. When choked flow is to be reached, I assume the orange curve would reach a maximum and would stay constant at increased pressure.

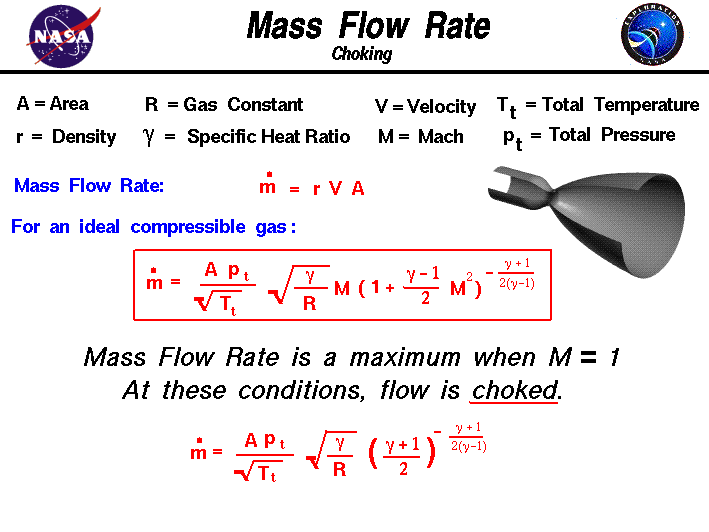
These statements are false. When a nozzle is choked, this means that the flow at the throat (smallest area) is sonic (M=1). Therefore, pressure waves downstream (after) of the throat cannot propagate to the throat since the flow is supersonic. This leads to the condition that downstream conditions can no longer affect the flowrate. However, upstream conditions still influence the flowrate. This can be seen in the equation for mass flowrate in the graphic below, where P_t (chamber pressure) is still a determining factor in the flowrate; also seen in the nozzle flowrate equation on your chart as P_c. For a more intuitive explanation, think of it this way: choked flow means that you cannot move any faster through the throat, but you can still increase the density of the gas being forced through the throat to increase the overall mass flow. This is why an increase in chamber pressure or a decrease in chamber temperature will lead to a higher density, and thus a higher m_dot.

So, with that in place, the chart you posted makes perfect sense, it is showing that the chamber pressure is self-stabilizing. The red combustion curve shows the increase in mass flow as chamber pressure increases (due to the positive feedback between chamber pressure and burning rate), while the orange curve shows the increase in outgoing nozzle mass flow as the chamber pressure increases. The system will equilibrate to a condition where these two flowrates are equal, and your chamber pressure will plateau at that value. At chamber pressures to the left of the intersection point, the mass flow in is greater than the mass flow out, so chamber pressure increases, and vice versa for the pressures to the right of the equilibrium point.

EDIT: One detail to add. The chart and my explanation are valid for propellants, meaning the pressure exponent in St. Robert's Law is < 1. For n > 1, you would have an exponentially increasing curve for the red (m_dot_in) curve, meaning you would have a runaway effect above the equilibrium point. Materials with n>1 will be your explosives, as the burn rate and pressure will increase until the structure fails.

NASA Mass Flow Rate Graphic

$\endgroup$

Your Answer

By clicking “Post Your Answer”, you agree to our terms of service and acknowledge you have read our privacy policy.

Not the answer you're looking for? Browse other questions tagged or ask your own question.