I have currently been testing my implementation of a numerical propagator with the ISS. Without going into much details, the propagator considers Earth gravity (with the GGM03S model including zonal, tesseral and sectoral spherical harmonics, up to a degree of 180), third-body gravitational attraction (from the Sun, Moon, and all other main planets of the Solar System), solar radiation pressure and, possibly the most relevant for this question, atmospheric drag using the NRLMSISE-00 atmospheric model.
The specific data I'm using for tests are the ISS trajectories provided by NASA in OEM format. In particular, I'm using the ephemerides generated the 2021-12-21 at 01:28:14.122 UTC, covering from 2021-12-20 12:00:00 to 2022-01-04 12:00:00 (UTC).
For my tests, I took the first provided ephemeris and used it as the starting point for the propagator. I then propagated the orbit for close to 24 hours (for completion, using the RADAU5 integrator), outputting state vectors at the exact same times as the ephemerides provided in the original OEM file, to allow direct comparison at each time point without requiring interpolation. Conveniently, the OEM file includes the following details about the ISS: mass (448009 kg), drag area (1492.30 squared meters), drag coefficient (2.05), solar radiation area (0) and solar radiation coefficient (0). So I used these exact same values during propagation.
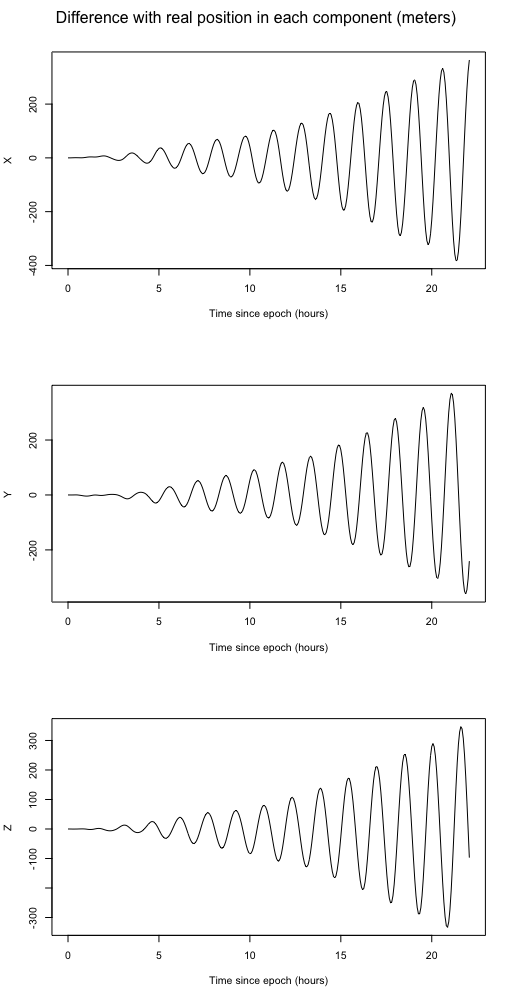
The following is a plot of the difference for each position component (in GCRF frame) between the calculated trajectory and the "real" trajectory (i.e., the values in the OEM file by NASA, which I guess is as close as one can get to a real trajectory using publicly available data):
As the plot shows, there is a periodic error of increasing magnitude in all components, reaching over 200 m in each component after around 20 hours of propagation.
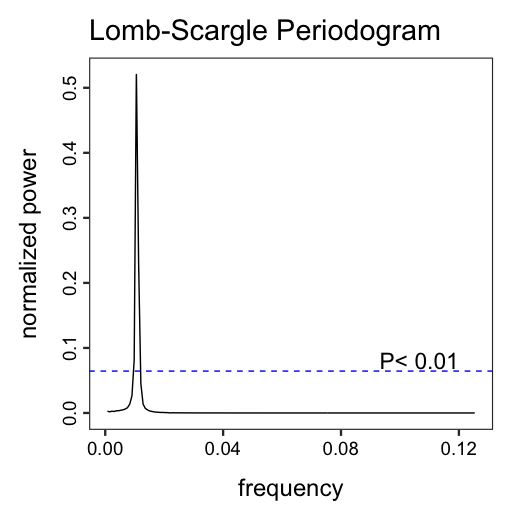
I calculated a periodogram of the error, resulting in the following:
Where the frequency is in $min^{-1}$. The peak corresponds to a frequency of 0.010574 $min^{-1}$, which gives a period of around 94 minutes. So basically, the orbital period of the ISS interestingly.
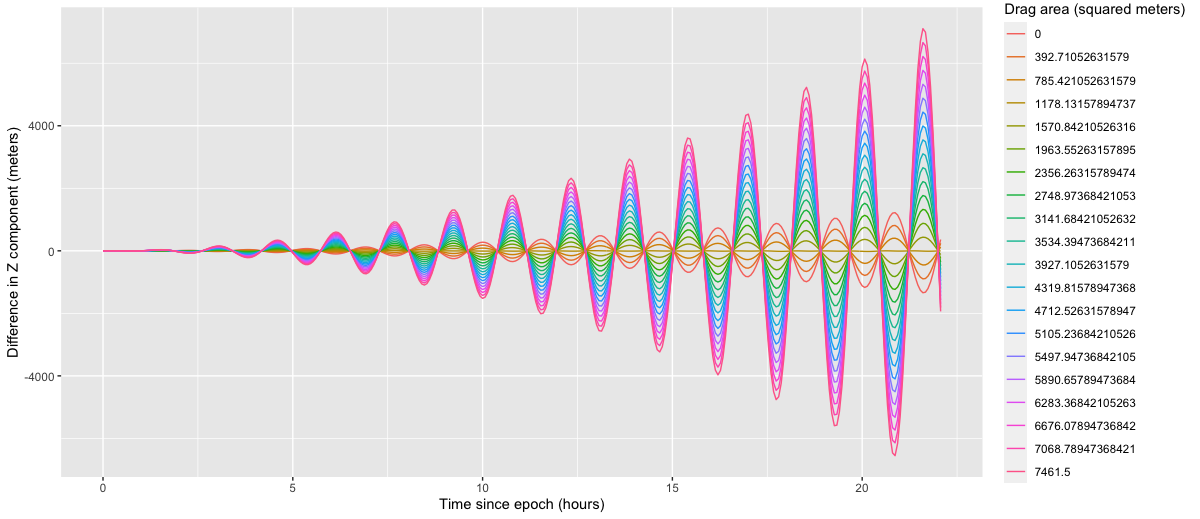
I then wondered if the drag force was being wrongly modeled, so decided to test a range of drag areas (I guess it would have been equivalent to testing a range of drag coefficients, since the final result is just introducing a multiplier to the drag force). In particular, I tried propagation with 20 values equally spaced from 0 to 5 times the value provided by NASA in the OEM file. The following plot shows the error along the Z component of position for each drag area value (similar plots are obtained for the X and Y components):
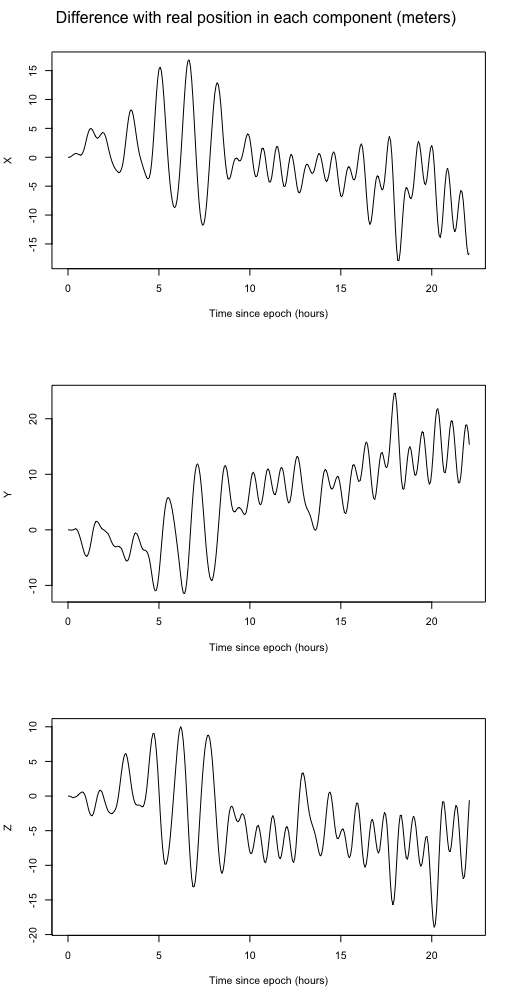
As you can see, the 5th value in the series (~1178.1316) leads to a quite big reduction of the error. The following plot shows the error with that drag surface along all position components:
This value is approximately 80% of the value given by NASA.
My question is: does anybody have any idea of why the propagation becomes so much more accurate by using this reduced drag?
I thought a possibility would be that the ISS would be doing some sort of maneuver to prevent loss of altitude and using a reduced drag somehow accounts for this. However, this would require that such operations are performed with a relatively high frequency, but from a quick search, this seems to not be the case.


