tl;dr: It looks like Hu et al (2022) (linked below) has done just that using catalogs of TLEs and the Python package Skyfield. Others have done similar but less thorough calculations - I think this one is the gold standard at the moment.
There are two issues here, a satellite can be visible in (at least) two three ways:
- If it is sunlit it can appear as a bright, star-like streak. Your calculation will require to check each object that crosses your telescope's field of view and see if it is sunlit or eclipsed.
- If it is in eclipse (in the Earth's shadow) it can still momentarily block an object causing it to momentarily "wink out" for of order a millisecond. See for example answers to A black cube 1 mile per side appears in geosynchronous orbit around the earth. Who would spot it and how would they do it? How easy would it be?.
- Of course if you are looking at long wavelength infrared, satellites will appear bright due to thermal radiation. This is how most near earth asteroids are found -- their thermal infrared radiation.
Two Line Element sets or TLEs for everything in orbit around the Earth that is being tracked are available at Celestrak (open access) and Space Track (requires registration and an email address).
For "secret" objects not in the main catalogs you can still find TLEs
To get positions and velocities (i.e. orbital state vector)s of objects from their TLEs one must use SGP4 which is available in many different platforms. Many people learn a bit of Python and then use Skyfield.
See also in Astronomy SE:
For the new, huge field-of-view survey telescope at the Vera C. Rubin Observatory
(formerly the Large Synoptic Survey Telescope or LSST), these monster constellations of satellites were going to be a real problem. See for example Jinghan Alina Hu et al (2022) Satellite Constellation Avoidance with the Rubin Observatory Legacy Survey of Space and Time where the authors used cataloged TLEs and Skyfield.
You can also click on the skyfield tag here or in Astronomy SE (skyfield) and see some interesting related questions in Astronomy SE:
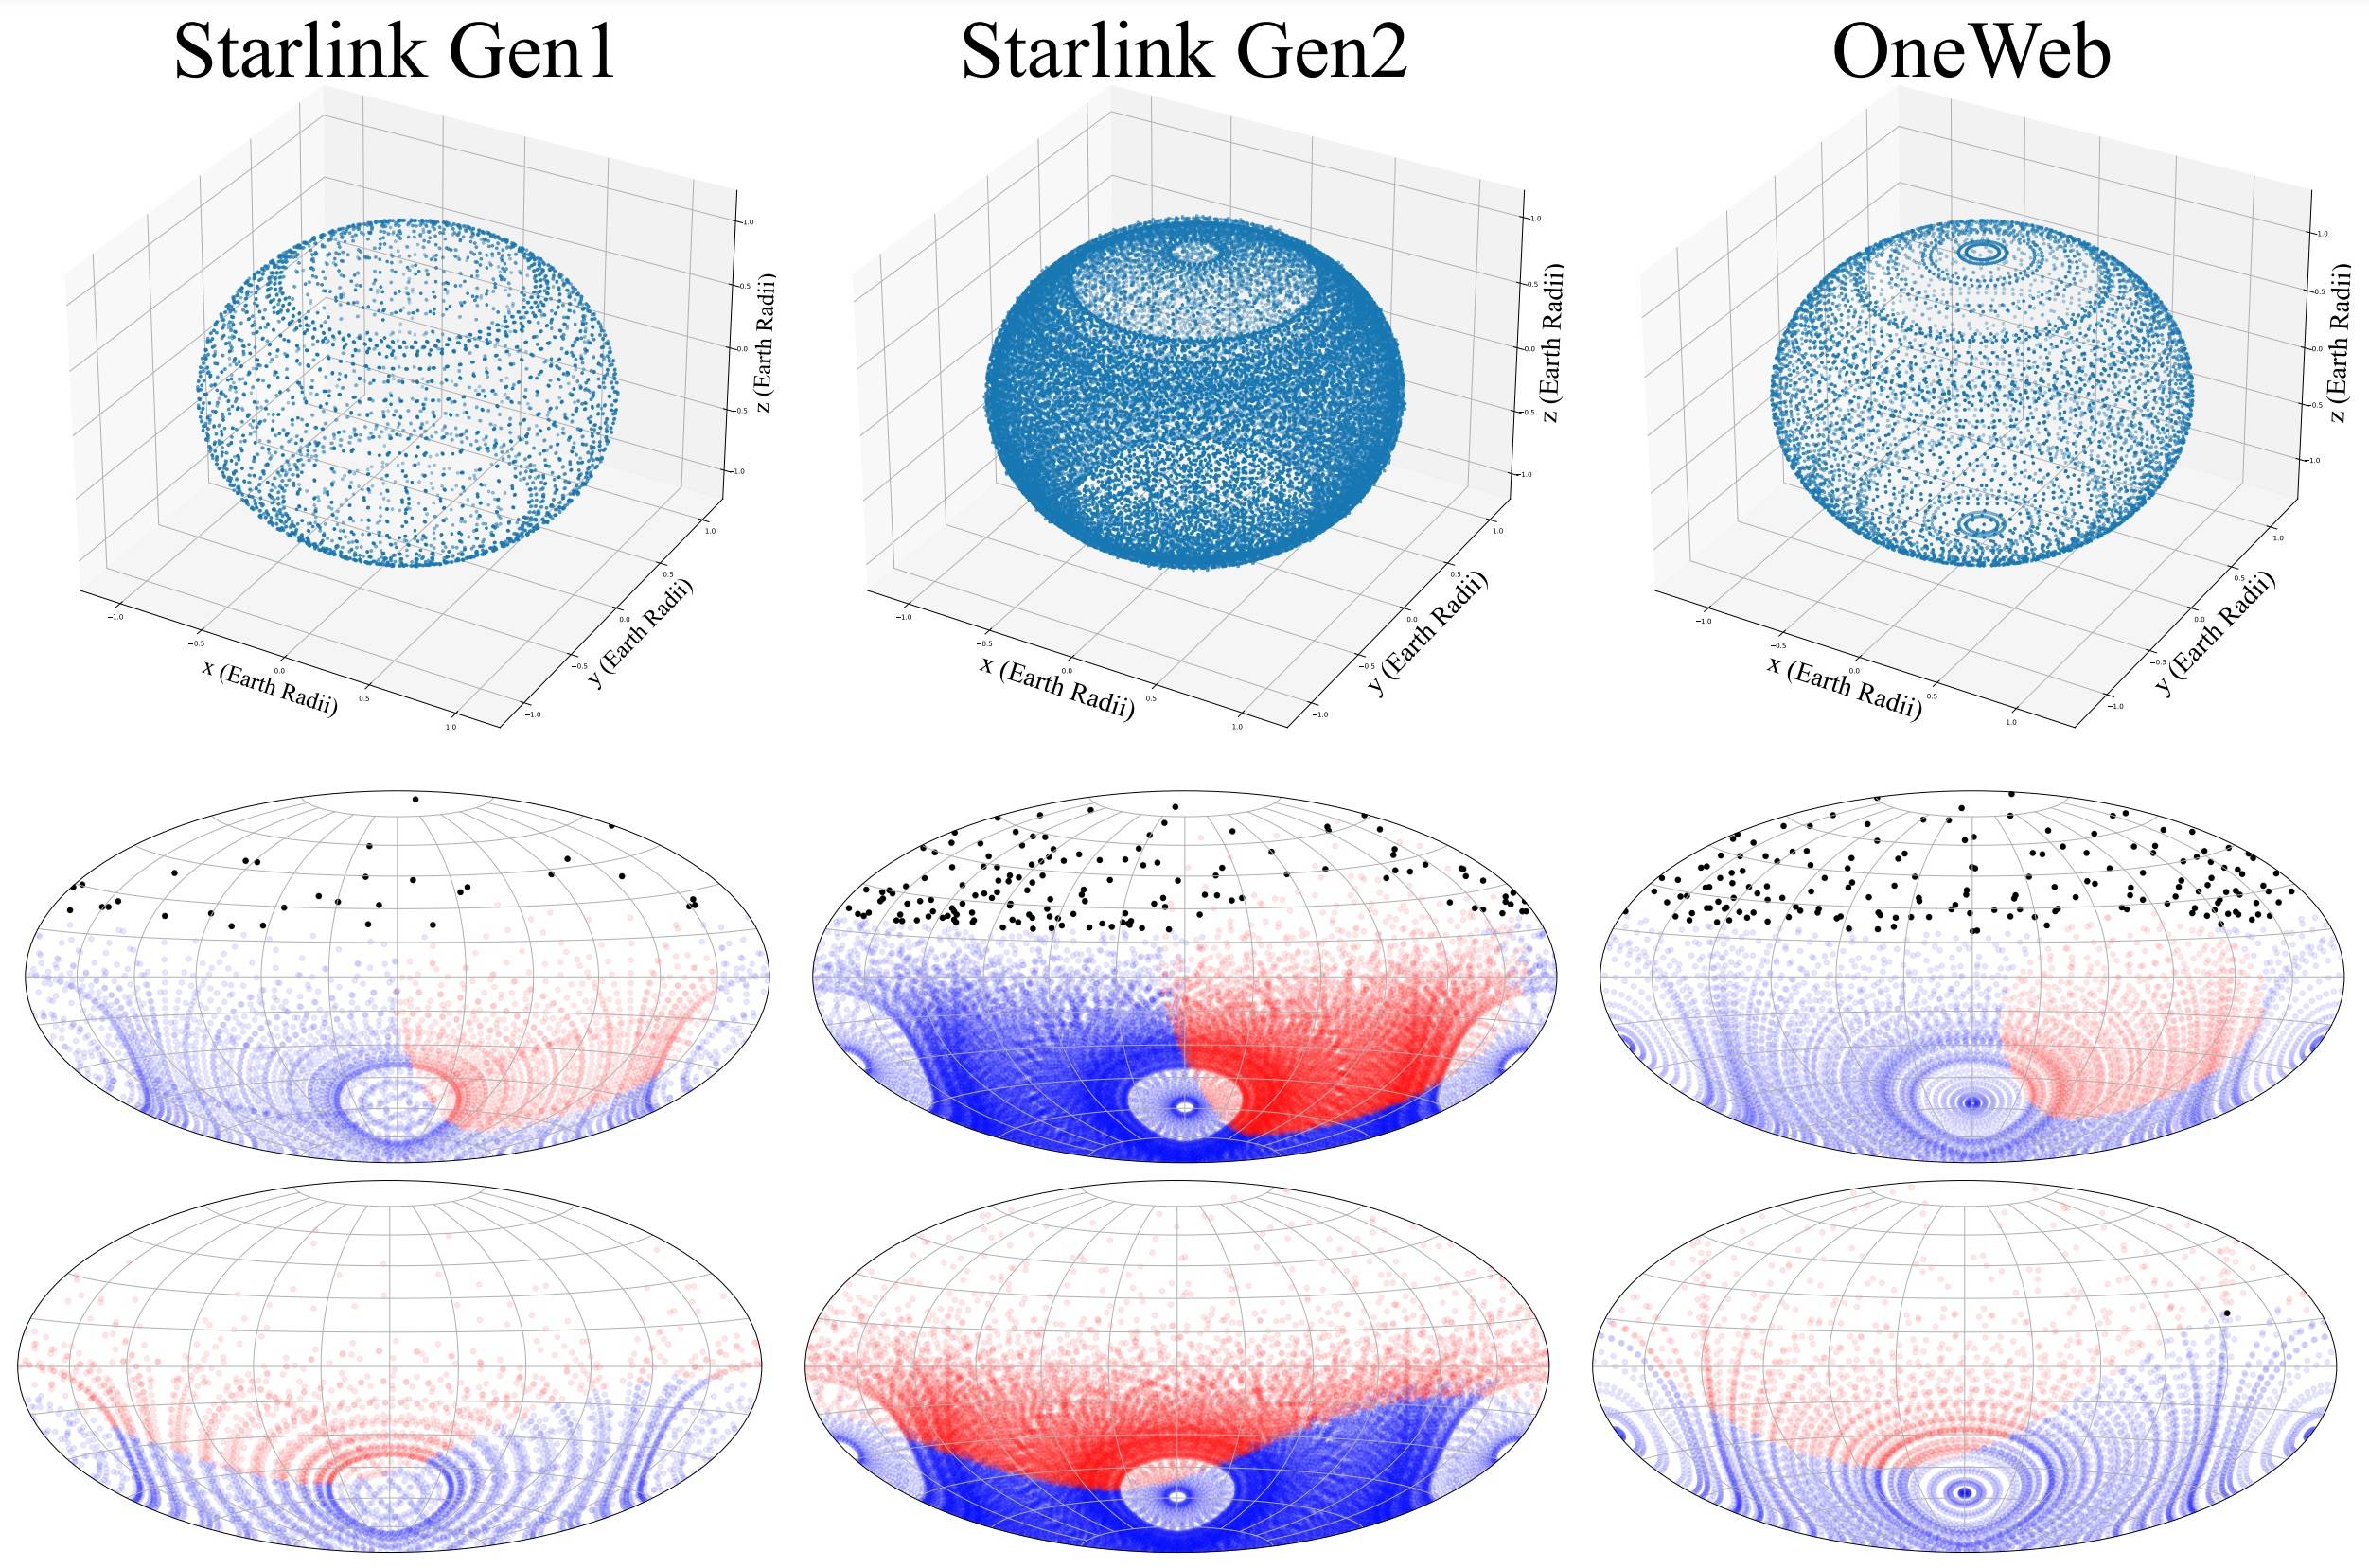
From Hu et al. (2022)

Figure 1. Three simulated satellite constellations, one per column. Starlink Gen1 is 4,408 satellites, Starlink Gen2 is 29,988 satellites, and OneWeb is 6,372 satellites, for a grand total of 40,768. The top row shows the 3D distribution of each constellation
around Earth. The middle row shows an instantaneous Hammer projection of the altitude and azimuth positions of each
constellation as seen from Rubin Observatory on October 1, 2023 during twilight (Sun altitude −18 degrees). Blue points
are satellites illuminated by the Sun at this time, red points are satellites not illuminated by the Sun, and black points are
satellites that are both illuminated and above the Rubin 20 degree altitude pointing limit. The bottom row is the same Hammer
projections six hours later in the middle of the night (Sun altitude −50 degrees). Because Starlink satellites orbit at 550 km,
none are illuminated in the middle of the night at this time of year. The OneWeb constellation at 1200 km has only a single
illuminated satellite above the Rubin altitude limit at this particular time.
