I'll venture an answer.
First, if you look at the actual data output from the ephemeris, you can see that around the year 2000 the Earth+Moon center of mass (barycenter) is moving in a plane parallel to the ecliptic within a few hundred kilometers. Both the Earth and the Sun slowly drift up and down because the origin of the coordinate system is actually the center of mass of the solar system, and the other planets, Jupiter and Uranus in particular, have to be taken into account.
I never really use those generated orbital elements. They are an approximation - a fit - to the motion of the body at that particular time. You can propagate the motion of the body for a short time using them, but they are not meant to be used to describe long-term motion.
The solar system is a bunch of objects all interacting with each other. The sun is not (really) in the center, and the planets do not (exactly) even orbit around the Sun.
So, for example if you look at the same orbital elements around the Sun instead of around the entire solar system barycenter, you'll see that the inclination drops to 0.0001 degrees. If at all possible, stick to the cartesian (x, y, z) data to avoid having to think about these issues.


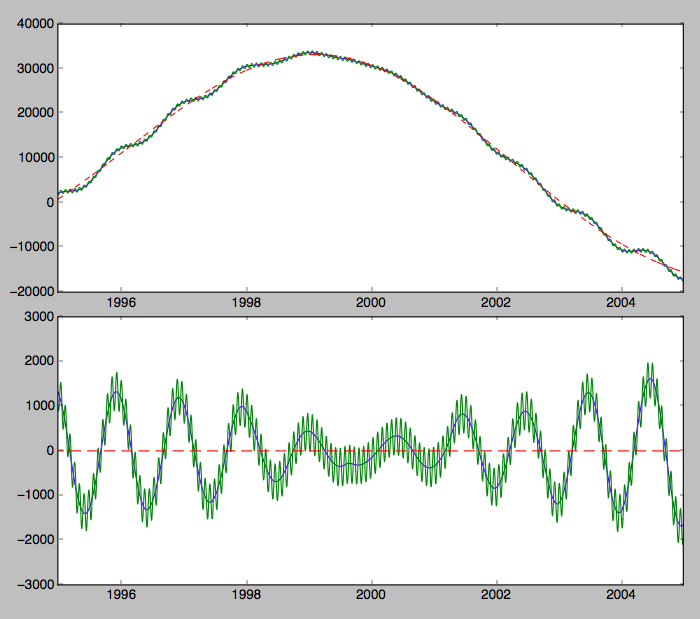
above: data from JPL Horizons database. These are the z-coordiantes only - perpendicular to the ecliptic. Units are kilometers. Solid smooth line is the Earth-Moon barycenter. Solid wiggly line is the Earth Geocenter, and dashed line is the sun. TOP: raw z-coordinates, BOTTOM: z-coordinates minus z-coordinates of the Sun.
Away from the year 2000, the Earth is moving up and down once per year relative to the sun. It flattens out around 2000, when the Earth's orbit coincides with the ecliptic by definition.
Here is the python script I used to read the data and make the plot. It's not pretty but it does the job.
import numpy as np
import matplotlib.pyplot as plt

fnames = ['J2000 Earth Barycenter horizons_results.txt',
          'J2000 Earth Geocenter horizons_results.txt',
          'J2000 Sun horizons_results.txt']

names  = ['Earth_Barycenter', 'Earth_Geocenter', 'Sun']

JDs, positions = [], []

for fname in fnames:

    with open(fname, 'r') as infile:

        lines = infile.read().splitlines()

        iSOE = [i for i, line in enumerate(lines) if "$$SOE" in line][0]
        iEOE = [i for i, line in enumerate(lines) if "$$EOE" in line][0]

        print iSOE, iEOE, lines[iSOE], lines[iEOE]

        lines = [line.split(',') for line in lines[iSOE+1:iEOE]]
        JD  = np.array([float(line[0]) for line in lines])
        pos = np.array([[float(item) for item in line[2:5]] for line in lines])

        JDs.append(JD)
        positions.append(pos)

JD = JDs[0]  # assume they are identical

class Obj(object):
    def __init__(self, name):
        self.name = name

things = []

for name, pos, JD in zip(names, positions, JDs):

    thing     = Obj(name)
    thing.pos = pos
    thing.JD  = JD

    things.append(thing)

earth_bary, earth_geo, sun = things

years = 2000. + (JD - JD[1826])/365.2564

if 1 == 1:
    fig = plt.figure()

    ax1 = plt.subplot(2,1,1)
    ax1.plot(years, earth_bary.pos.T[2])
    ax1.plot(years, earth_geo.pos.T[2])
    ax1.plot(years, sun.pos.T[2], '--')
    ax1.set_xlim(1995, 2005)
    ax1.get_xaxis().get_major_formatter().set_useOffset(False)

    ax2 = plt.subplot(2,1,2)
    ax2.plot(years, earth_bary.pos.T[2]-sun.pos.T[2])
    ax2.plot(years, earth_geo.pos.T[2]-sun.pos.T[2])
    ax2.plot(years, sun.pos.T[2]-sun.pos.T[2], '--')
    ax2.set_xlim(1995, 2005)
    ax2.get_xaxis().get_major_formatter().set_useOffset(False)

    plt.show()

