5
$\begingroup$

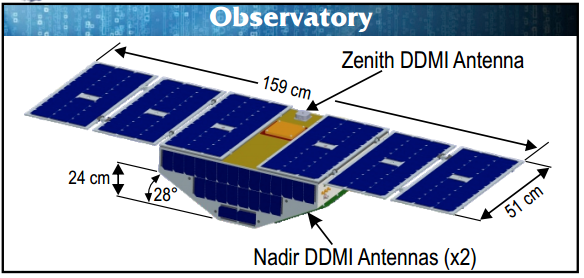
The Cyclone Global Navigation Satellite System is a group of 8 smallsats which will orbit near the equator (inc=30°) and work as a constellation to take data on typhoons and hurricanes. While they are meant to map wind speed they don't actually do that. They measure ocean surface roughness, but they don't even to do that. Each of the eight smallsats will carefully monitor up to four GPS satellite signals, and for each signal the direct beam and the reflected beam off of the ocean will both be measured.

How (actually) will the CYGNSS satellites interpret ocean roughness by comparing direct and reflected signals from GPS satellites? I'm interested in an explanation of how the received signals will be compared to extract a number for ocean roughness.

See these items also:

CYGNSS

CYGNSS

above x2: screen shots from CYGNSS_FactSheet_October2014

$\endgroup$
3
  • $\begingroup$ You can tell the height of the ocean surface in this manner by timing how long it takes the signal to return, just like in radar. I assume that each satellite will measure a signal bounced off a certain location. By doing this over several locations, you can figure out how level the ocean is. If it's perfectly flat, each satellite will register the signals as arriving at the same time. Otherwise there will be some difference in altitudes, the difference being the height of the waves. At least, that's what I assume is happening. $\endgroup$
    – Phiteros
    Commented Nov 12, 2016 at 17:35
  • $\begingroup$ Let us continue this discussion in chat. $\endgroup$
    – Phiteros
    Commented Nov 13, 2016 at 3:54
  • 2
    $\begingroup$ If you are interested in these topics, I suggest you to register for the IGARSS 2020 online conference that will start next Monday. It's tipically quite expensive, only interesting for those really working on related topics. But this year, due to the covid situation it's online and it costs just 10 USD. IGARSS is the main remote sensing congress focused on engineering and physics. Don't expect too much "science". I actually believe this deserve to be posted somewhere else, but I don't know if it's possible in stackexchange. I am not related with IGARSS. I am not even presenting anything. $\endgroup$ Commented Sep 25, 2020 at 21:19

7 Answers 7

8
$\begingroup$

Addressing multipath has long been a challenge with regard to GPS. Carrying a GPS-enabled smartphone toward the heart of a large city results in GPS-estimated positions and altitudes that bounce around. The problem is signals reflecting off of buildings, sometimes multiple times. Those reflecting surfaces result in multiple paths that a GPS signal can follow to reach a GPS receiver, hence the term "multipath".

Rather than being confused by multipath, CYGNSS takes advantage of it. Each CYGNSS satellite receives a direct GPS signal that tells the satellite where it is. The satellites also receive multiple indirect signals due to reflections from the surface of the Earth. The spectrum of how those bounced signals trail off over time provide information regarding the local roughness of an ocean's surface. The spectrum of delays from a very smooth surface versus a very rough surface differ markedly.

$\endgroup$
2
  • $\begingroup$ They seem to use a 2D delay vs doppler plot, and correlate roughness with intensities at different delays, where different delays represent different distances away from the specular point. A very smooth ocean surface for example would only reflect close to the specular point, while a very choppy sea with high wave angles could contribute reflections over a larger area and therefore larger spread in delays. But how they do it I don't know. $\endgroup$
    – uhoh
    Commented Nov 14, 2016 at 12:55
  • $\begingroup$ @David Hammen any sources? $\endgroup$ Commented Mar 19, 2023 at 18:00
6
$\begingroup$

Short version: you have to read the Algorithm Theoretical Basis Documents (ATBD), conveniently collected at https://clasp-research.engin.umich.edu/missions/cygnss/data-products.php . All of them. They are too long (143 pages in total, by my count) to do them justice here, but I will try to give you a whirlwind tour.

At the most basic, the satellite instruments measure raw detector counts, which are just numbers on some arbitrary and unknown scale. In NASA jargon, that is known as "Level 0" data. The Level 1A ATBD takes six pages to explain how to turn the raw counts into received power, measured in Watts. This is by far the simplest of the ATBDs, so it makes a good place to start.

The Delay Doppler Mapping Instrument on CYGNSS is a combination of a GPS receiver with a sort of microwave radiometer, which measures the total amount of energy deposited in each collector bin in some time interval. The raw values are called counts by convention. This is partly because they're integers, because that simplifies the on-orbit signal processing; and partly because if the incident radiation were perfectly monochromatic and the detector were perfectly efficient, energy deposited would be proportional to photon count, because photon energy is Planck's constant times frequency. Keep in mind, radio signals are all just photons, as infrared and ultraviolet and visible light and X-rays and gamma rays are all just photons, but you need very different designs and materials to make detectors sensitive to each kind.

CYGNSS's raw detector counts are linearly proportional to energy collected in each bin during each snapshot in time. Dividing by time length gives the average power, but not all of that power is the desired GPS signal. Some of it is noise collected by the antenna from the portion of the Earth in view; this is mainly thermal emission, because the radiation spectrum of a blackbody at 300 K extends well into the microwave. Some of it is noise generated within the receiver, due to thermal emission from the spacecraft itself. These sources must be continuously calibrated, so their estimated contributions can be subtracted out, and the result multiplied by the correct, experimentally-determined conversion factor.

The Level 1B ATBD takes sixteen pages to explain how to use knowledge of the orbits of both the CYGNSS spacecraft and the GPS spacecraft to locate where the specular (mirror-like) reflection is centered, and use that to turn power in Watts into Radar Cross Section (RCS) in square meters. This involves estimating a wide variety of possible errors, such as inconsistencies in the GPS satellite transmission power, unusually large temperature variation in the receiver's low-noise amplifier (LNA), and lots of other stuff.

The Level 2A ATBD, as linked by @danipascual, takes ninety-six pages to explain how to convert calibrated RCS into wind speed. This involves integrals galore, and the consideration of another dozen or more sources of noise, some of which can be calibrated out, but the rest you just have to live with (though you can make a good try at estimating their typical size, and people also try various ways to flag cases when they have grown unusually large).

The Level 2B ATBD takes nineteen pages to explain how to convert calibrated RCS into Mean Square Slope (MSS), their chosen metric for surface roughness. This involves knowledge of the local weather in the area of reflection, because the models they use for connecting RCS to MSS depend on the sea surface salinity and temperature, which themselves come from analysis of the data derived from other kinds of weather satellites.

The Level 3 ATBD takes six pages to explain how to turn the Level 2 products, each of which is obtained from just one spacecraft, into a single, global, gridded data product combining measurements from all eight CYGNSS satellites.

I have never been involved with the CYGNSS project, but once upon a time I was a NASA contractor on a different weather science project, and what I did all day was execute some of the procedures described in our Level 2 ATBD (ours was 243 pages), and sometimes discuss parts of them with their creators. If you want to understand how it all is really done, the Algorithm Theoretical Basis Documents are the authoritative source.

$\endgroup$
2
  • $\begingroup$ Thank you for your answer! I can appreciate your points here. While painstaking to read, we can still be thankful that documented procedures exist. If these were laser pulses, then "raw detector counts" could be photons. But for radar the term seems curious. What exactly was counted? $\endgroup$
    – uhoh
    Commented Sep 25, 2020 at 1:21
  • 2
    $\begingroup$ Excellent answer. I was also a NASA contractor, sometimes writing software, but ATBD is a new term to me and I am excited to have learned it. $\endgroup$
    – Erin Anne
    Commented Oct 1, 2020 at 5:17
5
$\begingroup$

The CYGNSS spacecraft will use a technique called "Delay Doppler Mapping". Each satellite will be equipped with a Delay Doppler Mapping Instrument (DDMI), which is capable of receiving four DDM's at once. DDM is only slightly different from standard Radar Altimetry, which measures the distance to an object by tracking how long it takes a signal bounced off the surface to return. That is the 'Delay' part of DDM. When using DDM, you 'look' at the surface of the object for much longer, allowing you to integrate over the full time. This allows the signals to be weaker, because they will be integrated over a longer amount of time. In addition, DDM differs from radar because it uses the Doppler effect to track how fast (and in what direction) something is moving. DDM can be used to calculate how fast the wind is moving at the surface (1), which is one of the main goals of the study. CYGNSS will be using special (and highly complex) algorithms (2) to retrieve the wind surface speed.

In the case of CYGNSS, the signals will originate from orbiting GPS satellites. The satellites will also beam the signal directly to CYGNSS, so that they can compare the reflected response to the emitted signal. This idea was proposed back in 1993 (3). Since CYGNSS consists of eight smallsats, each capable of measuring 4 areas, the mission will be able to reconstruct the shape of the ocean surface and windspeeds there over a significant area.

From the shape of the ocean surface, researchers will be able to infer how rough the ocean is at that particular location. While there have been attempts to create a standard parameter for roughness, there currently is not one in use (as far as I could find). Instead, researchers will rely on factors such as the wave height, spacing, speed, and steepness to determine how rough the surface is. Higher and more closely spaced waves (thus steeper waves) indicate a rougher sea than shallow, long waves.

Emily Lakdawalla does a good job of explaining how DDM is used to get the shapes of asteroids on her blog.

Citations:

  1. Chen Li, Weimin Huang. "Sea surface wind retrieval from GNSS delay-Doppler map using two-dimension least-squares fitting" (2013). DOI: 10.1109/OCEANS-Bergen.2013.6608019
  2. Maria Paola Clarizia, Christopher S. Ruf. "Wind Speed Retrieval Algorithm for the Cyclone Global Navigation Satellite System (CYGNSS) Mission" (2016). DOI: 10.1109/TGRS.2016.2541343
  3. Daniel Pascual, et. al. "Precision Bounds in GNSS-R Ocean Altimetry" (2014). DOI: 10.1109/JSTARS.2014.2303251
$\endgroup$
8
  • $\begingroup$ My question is "How with the CYGNSS spacecrafts (actually) measure ocean roughness?" This is just a collection of sentences that skirt the issue. Also, your "Special Algorithms" link requires a privileged login ID. The radar imaging of asteroids is a third and also completely different technique. It only works on rotating bodies that are completely illuminated. You can't just jumble up a bunch of different technologies together and call it an answer. $\endgroup$
    – uhoh
    Commented Nov 13, 2016 at 4:58
  • $\begingroup$ My second paragraph: "How (actually) will the CYGNSS satellites interpret ocean roughness by comparing direct and reflected signals from GPS satellites? I'm interested in an explanation of how the received signals will be compared to extract a number for ocean roughness." $\endgroup$
    – uhoh
    Commented Nov 13, 2016 at 5:04
  • $\begingroup$ Perhaps I am misunderstanding your question. What are you asking for? How they parameterize ocean roughness? Or what technology they are using to do it? Or are you asking for exactly what mathematical equations and computer programs they use? Sorry about the broken link. Those papers are locked behind paywalls, so I had to use my university library. I'll replace the links with citations or something. $\endgroup$
    – Phiteros
    Commented Nov 13, 2016 at 6:56
  • $\begingroup$ @Phiteros It's great to have references ! Please complement the links with citations, not replace then :) $\endgroup$
    – Antzi
    Commented Nov 14, 2016 at 2:54
  • 1
    $\begingroup$ I thought I fixed them with direct links. I will just replace the links with citations instead. I will also attempt to clarify my answer. From what I have found, there basically is no standard parameterization for surface roughness. Instead, you just infer how rough the ocean surface is from factors like the wave height, spacing, and steepness. $\endgroup$
    – Phiteros
    Commented Nov 14, 2016 at 15:29
2
$\begingroup$

This is explained in the mission Science Briefing. Basically, they are measuring the distortion of the GPS signal reflected by the water surface.

On a calm flat surface, the reflection is specular, I.e undistorted. The more rough the surface is, the more the reflection becomes diffuse.

You can observe the same effect if you observe the reflection of e.g. the moon on a calm resp. rough lake surface.

$\endgroup$
1
  • $\begingroup$ The video of the briefing is really helpful - the graphics showing the multiple specular points per satellite and coverage over time really helps. I understand the basics of the delay-doppler plot starting at 09:10, delay is shortest at the specular point (principle of least time) and increases with a sort-of radial gradient (shown as CHIPS), and the doppler variation just comes from the geometry of the rates of change of the different total path lengths, but starting from a series of delay-doppler 2D histograms, how is that processed to arrive at some metric that correlates with roughness? $\endgroup$
    – uhoh
    Commented Dec 14, 2016 at 14:40
2
$\begingroup$

CYGNSS uses Delay Doppler Reflectometry to record ocean choppyness. What this means is, essentially, the satellites listen to GPS signals bounce off the ocean surface and look at how much the signal is scattered and delayed. The data is published at different levels, and the algorithms between the levels aren't necessarily public. However, the level 0 data has pretty usable data as is; for example, this article shows an example of how just simple signal-to-noise ratio (listed as 'signal strength') gives an obvious difference between water and land.

CYGNSS data delineates the streams and tributaries across the Amazon basin in South America.

Each satellite gets a few (3-4, normally) spectral tracks on the ocean where GPS signals bounce off; those are the spots we can measure. With 8 satellites in orbit we can get pretty good coverage of the east coast of the US with pretty fast turnaround times for data; the satellites are talked to nominally once per day but special circumstances (like hurricanes) occasionally call for more frequent downlinks.

Other answers, of course, covered all of this well, but I feel obligated to post an answer since I was a Flight Controller for CYGNSS :)

$\endgroup$
6
1
$\begingroup$

I am not sure what you mean by "ocean roughness", but the CYGNSS products are wind speed and Mean Square Slope (MSS). You can read the retrieval algorithms here (pag 47) and here (page 5) respectively.

$\endgroup$
3
  • $\begingroup$ Thanks for your answer and welcome to space! What I mean by roughness is the same thing as what the designers of CYGNSS mean. That's the measurement that CYGNSS actually makes. The relatively weak radar signals can't probe the atmosphere directly, but the can scatter off the surface of the ocean which returns a signal that is strongly affected by the shapes and heights of the waves, and those in turn are determined in some part by the recent history of surface wind. Those are excellent links, and I think an answer post can draw from them and generate a good answer. $\endgroup$
    – uhoh
    Commented Sep 23, 2020 at 15:39
  • $\begingroup$ In fact, what I wrote just now can be quoted as the first few sentences of that answer! But an answer needs to explain how this is done, "depends on" doesn't do that sufficiently. $\endgroup$
    – uhoh
    Commented Sep 23, 2020 at 15:40
  • 2
    $\begingroup$ If you want to know the exact equations that are used, this is the answer you need. Aside from camping out at the desk of someone involved and reading their code, the Algorithm Theoretical Basis Document linked here is your only hope of a full and complete answer. Note that this is the Level 2 ATBD, which describes how the raw measurements collected by the satellite are turned into physical quantities. There are also ATBDs for other levels at clasp-research.engin.umich.edu/missions/cygnss/… , which also includes a nice flowchart of what the different levels mean. $\endgroup$
    – Ryan C
    Commented Sep 24, 2020 at 20:56
0
$\begingroup$

How (actually) will the CYGNSS satellites interpret ocean roughness by comparing direct and reflected signals from GPS satellites? I'm interested in an explanation of how the received signals will be compared to extract a number for ocean roughness.

I stumbled upon a pretty good explanation by accident. The Taiwan National Science and Technology Council's main web page is currently featuring an image of the Triton (Formosat 7R) satellite and links to this Taiwan Space Agency (TASA, formerly NSPO)'s page which shows the following graphics (click for larger):

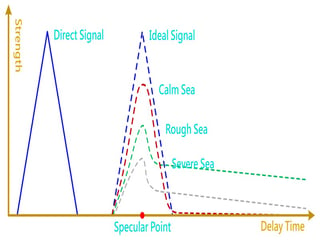
Triton (Formosat 7R) from https://www.tasa.org.tw/inprogress.php?c=20030305&ln=en Triton (Formosat 7R) from https://www.tasa.org.tw/inprogress.php?c=20030305&ln=en

The 2nd image shows a rough illustration of intensity vs time for a given signal from a GPS satellite; first there's a sharp peak labeled "direct signal" which would be line-of-sight from a GPS satellite to any GNSS-Reflectometry (GNSS-R) satellite, be it CYGNSS or Triton or others.

This is followed by a delayed peak centered at the "specular point" when a signal reflected off of a smooth, "shiny" ocean would arrive.

The diagram shows two effects related to sea surface roughness due to wind

  1. a reduction in the prompt reflected intensity from the specular point
  2. presence of a variable amount of delayed reflected intensity from any other areas on the ocean surface, which via Fermat's principle or principle of least time will always be delayed relative to the specular signal.

A helpful analogy is the reflection of sunlight off of a body of water seen from some height; either one you are standing next to, or from space. Smooth seas will show a small, self-contained reflection of the Sun, choppy seas will show reflected light from a much larger patch.

While our eyes use a lens and retina to convert Fermat's least time to a spatial image corresponding to angle, the non-imaging satellite uses a more direct measurement of time to differentiate the concentrated reflection near the specular point from diffuse, off-specular reflection from choppy areas further away.

Of course they will use more complicated signal processing to do that. I found this nice document GNSS-R 遙測技術的工程應用 (found here (google: "GNSS-R Engineering Application of Telemetry Technology")

Putting the relevant section into google translate and doing a little cleanup:

GNSS-R Application of sea surface wind farm and roughness.

The route of the GPS reflection signal is longer than that of direct-firing signals, and it will generate delays. In addition, the impact of the roughness of the reflection point and the scattering of the reflection signal scattering. Under the action of wind, the sea surface causes the waves to change the roughness of the sea surface. The larger the wind speed, the greater the roughness of the sea surface, and the greater the degree of changes in the impact of the reflected signal; the slower the wind, the smoother the waveform2, as shown in Figure 6.

Zavorotny, Voronovich, and Sensing17 theoretically modeled describes the global positioning system (GPS) signal and the relationship between the power and the sea wind field. Then El Fouhaily, Thompson, Linstrom, and Sensing18 further improve the model. Clarizia, Ruf, Jales, Gommenginger, and sensing17 proposed minimum Variance (MV) Wind Speed Estimator, using 5 different observations Point to establish GNSS-R Delay-DopPler Maps (DDMS), and push further to estimate the sea wind farm. Foti et al. 20. The secondary shift remote test display has good consistency with the measured data (Figure 7).

2Katzberg, S.J. and Garrison Jr, J.L. (1996). Utilizing GPS to determine ionospheric delay over the ocean.

17Zavorotny, V.U., Voronovich, A.G., and Sensing, R. (2000). Scattering of GPS signals from the ocean with wind remote sensing application. IEEE Transactions on Geoscience and Remote Sensing, 38(2), 951-964. IEEE, Researchgate and University of Michigan

18Elfouhaily, T., Thompson, D.R., Linstrom, L., and Sensing, R. (2002). Delay-Doppler analysis of bistatically reflected signals from the ocean surface: theory and application. IEEE Transactions on Geoscience and Remote Sensing, 40(3), 560-573. IEEE

19Clarizia, M.P., Ruf, C.S., Jales, P., Gommenginger, C., and Sensing, R. (2014). Spaceborne GNSS-R minimum variance wind speed estimator. IEEE Transactions on Geoscience and Remote Sensing, 52(11), 6829-6843.

20Foti, G., Gommenginger, C., Jales, P., Unwin, M., Shaw, A., Robertson, C., and Rosello, J. (2015). Spaceborne GNSS reflectometry for ocean winds: First results from the UK TechDemoSat‐1 mission. Geophysical Research Letters, 42(13), 5435-5441.

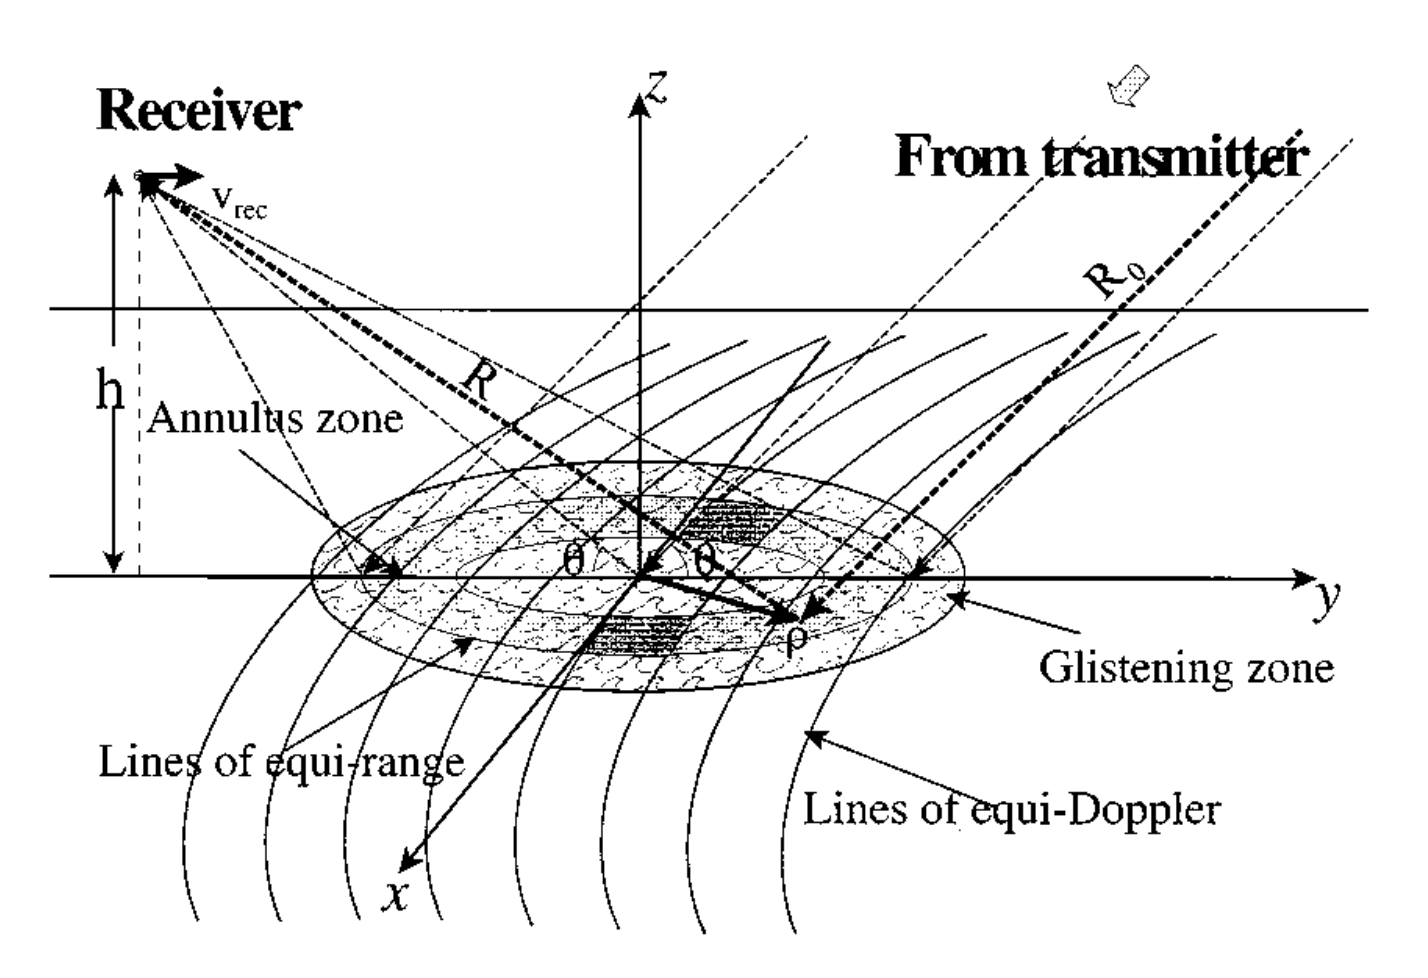
From here is an illustration of how the time delay and doppler shift provide some information about the location of a reflected component relative to the specular point.

As far as I can tell, the technique involves three parts

  1. develop a complete theoretical framework to predict intensity as a function of incoming/outgoing directions for each of a large number of different wave shapes associated with wind speed (and unfortunately history, waves build up and die down over time, only the smallest ones are short-term proxies)
  2. measure as much as you can that's related, using existing satellites and demonstrators
  3. compare the results to "ground truth" or "water truth" measurements of wind speeds
  4. say to yourself "oh, it's not so good of a fit"
  5. come up with some kind of multivariate model with several parameters that helps to improve the poor correlation between measured wind speeds and algorithms operating on recorded GNSS-R data.
  6. say it works well, mission success!

"Fig. 2. Configuration of glistening, annulus, and Doppler zones." from avorotny, V.U., Voronovich, A.G., and Sensing, R. (2000). Scattering of GPS signals from the ocean with wind remote sensing application. IEEE Transactions on Geoscience and Remote Sensing, 38(2), 951-964.  https://ieeexplore.ieee.org/document/841977

Fig. 2. Configuration of glistening, annulus, and Doppler zones.
$\endgroup$

Your Answer

By clicking “Post Your Answer”, you agree to our terms of service and acknowledge you have read our privacy policy.

Not the answer you're looking for? Browse other questions tagged or ask your own question.