5
$\begingroup$

The Reuters article Russia, U.S. duel at U.N. over whether North Korea fired long-range missile describes some ongoing United Nations Security Council discussion related to the classification of the recent test. I am not sure if it is the launch vehicle's potential capability or demonstrated capability that is used in order to distinguish between medium-range and long-range classifications, as well as unfamilliar what those classifications actually mean.

Can someone clarify these terms, and how they are applied in difficult-to-verify situations?


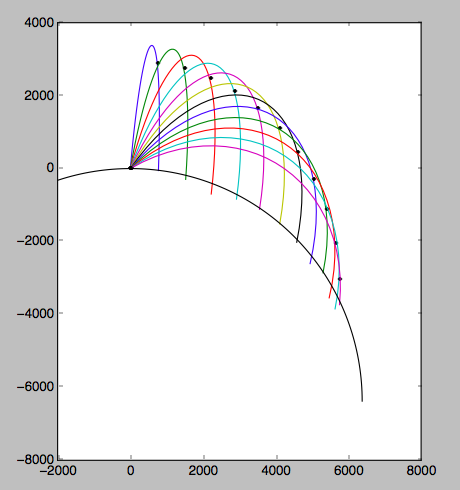
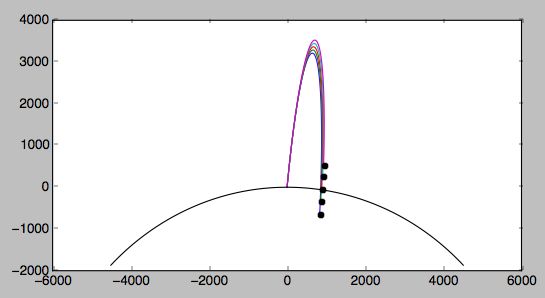
below: Simplistic simulation of a ballistic trajectory with initial velocities of 6,500 to 6,700 m/s at a small angle, with the dots representing location after 40 minutes (first plot) and 28 minutes (second plot). This is just to get a rough feeling for the scale of the trajectory and not an accurate representation of the real event, but it illustrates that the potential range of the launch is much much farther than the range of the test because the launch was nearly vertical

enter image description here

enter image description here

def deriv(X, t):
    x, v = X.reshape(2, -1)
    acc  = -GMe * x * ((x**2).sum())**-1.5
    return np.hstack((v, acc))

import numpy as np
import matplotlib.pyplot as plt
from scipy.integrate import odeint as ODEint

eightthpi, quarterpi, halfpi, pi, twopi = [2**n*np.pi for n in range(-3, 2)]
degs, rads = 180/pi, pi/180

GMe = 3.98600418E+14     # m^3 s^-2
re  = 6378000.
kms = 1E-03

time = 60 * np.arange(0, 41)

answers = []

# v0s = np.linspace(6500, 6700, 5)
#     for v0 in v0s:

v0 = 6600.
thetas = rads * np.arange(5, 61, 5)

for theta in thetas:
    X0 = np.hstack(([0, re], [v0*f(theta) for f in [np.sin, np.cos]]))

    answer, info = ODEint(deriv, X0, time, full_output=True)
    answers.append(answer)

if 1 == 1:
    plt.figure()
    for answer in answers:
        stop = np.argmax(np.sqrt((answer.T[:2]**2).sum(axis=0)) < re-1000)
        x, y = kms*answer[:stop+1].T[:2]
        print stop,
        plt.plot(x, y-kms*re)
        plt.plot(x[::28], y[::28]-kms*re, '.k')
    theta = np.linspace(0, halfpi+eightthpi, 100)
    x, y = [kms*re*f(theta) for f in [np.cos, np.sin]]
    plt.plot(x, y-kms*re, '-k')
    plt.xlim(-2000, 7999)
    plt.show()
$\endgroup$
1

1 Answer 1

4
$\begingroup$

Ballistic missiles are usually divided into groups based on range. These groups were originally defined by the US military.

  1. Intercontinental (ICBM), with a range of more than 5500 km, i.e. able to reach the US from Russia v.v.

  2. Intermediate-range (IRBM), with a range of 3,000–5,500 km. Able to reach Moscow from the UK. Still a strategic asset.

  3. Medium and short range ballistic missiles, anything with a shorter range than an IRBM. Generally meant to be used in the area (theatre) where war is being waged, but some countries use them for strategic purposes too (deterrent).

A country like the USA can verify some aspects of the launch. With a ballistic missile tracking radar stationed at sea or in South Korea (or at the altitudes we're talking about, much further away), they can monitor the trajectory. They can monitor the missile's radio transmissions (they might be encrypted though). They could to spectroscopy on the exhaust plume.

As you noted, there's some guesswork involved too. Espionage assets can give a pretty good idea of how large the missile is, which gives an upper bound to performance. North Korea may have programmed the flight to be ambiguous (range near the IRBM/ICBM threshold) on purpose.

$\endgroup$
4
  • 1
    $\begingroup$ This may be a definition and that's part of my question, but I've also asked how to classify "in difficult-to-verify situations" and about the most recent test by North Korea in particular. Are they doing some sophisticated version of my simple calculation? It certainly looks to me as though anything that has a roughly 40 minute ballistic trajectory is de facto long range. $\endgroup$
    – uhoh
    Commented Jul 20, 2017 at 18:32
  • $\begingroup$ ...however considering the sensitive nature of the subject, this may be as good as it gets. ;) $\endgroup$
    – uhoh
    Commented Jul 26, 2017 at 6:13
  • 1
    $\begingroup$ I think you're on the right track with your plots. Aerodynamics make things more complicated (lower trajectory = more time spent in the atmosphere). $\endgroup$
    – Hobbes
    Commented Jul 27, 2017 at 9:20
  • $\begingroup$ I kept it purposefully simplistic and a nice round 40 minutes just to illustrate the concept. There are subtleties, like do they assume the range was the full range, or try to account for tricks like adding extra, hidden weight or using suboptimal stoichiometry to make the rocket appear less efficient than it really is, etc. $\endgroup$
    – uhoh
    Commented Jul 27, 2017 at 9:27

Your Answer

By clicking “Post Your Answer”, you agree to our terms of service and acknowledge you have read our privacy policy.

Not the answer you're looking for? Browse other questions tagged or ask your own question.