3
$\begingroup$

NASA's Deep Space Network activity can be viewed conveniently at https://eyes.nasa.gov/dsn/dsn.html but if you would like data in a more raw XML form, it can be accessed as described in this answer

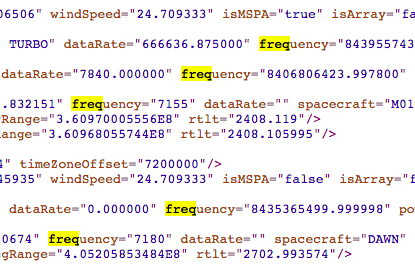
edit: per request, the example XML there is https://eyes.nasa.gov/dsn/data/1365107113.xml but they are issued frequently. Here's a screenshot indicating what a bit of one looks like demonstrating that frequency is in different units in different places:

screenshot of XML of DSN

As discussed in this answer and in comments below it, the units in the XML data need to be understood, as they are not reported within the XML itself. Even though each XML carries of order 10,000 characters with lots of repetition, it doesn't self-report its own units.

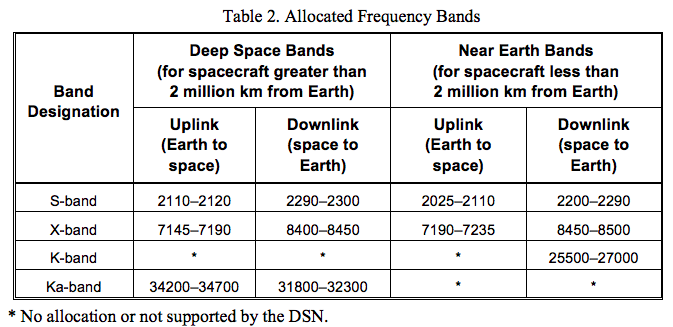
In the case of frequency, the downlink values are in MHz while the uplink values are in Hz as shown in this answer. But that is just a guess because I believe that frequency values of 7150 and 8.4E+09 for a direct link from the Curiosity Rover to a DSN 70 meter dish have got to be standard X-band deep space frequencies. But I have no authoritative source for the units beyond guesswork.

enter image description here

Source: this answer, originally from the DSN Telecommunications Link Design Handbook 201, Rev. B, Frequency and Channel Assignments, Released December 15, 2009

And also, what about power? How can I know for sure if the uplink and downlink power expressed in the XML files are referenced to 1 mW or 1 W (for example dBm, vs dbW) or straight kiloWatts? With an uplink power value of 20 and downlink of -160, I'd guess that those are linear kiloWatts up and dBm or dbW down since 20 kW is a common DSN maximum power and I have seen numbers like -150 dBm from deep space before.

But I have no source for that, yet.
enter image description here

$\endgroup$
4
  • $\begingroup$ @DrSheldon I don't know about "should" but in this case it definitely isn't MHz and has got to be Hz. 8.4E+09 MHz would be UV light with a wavelength of 36 nm. See i.sstatic.net/XvHm0.png and also eyes.nasa.gov/dsn/data/1365107113.xml $\endgroup$
    – uhoh
    Commented Nov 27, 2018 at 5:02
  • $\begingroup$ @DrSheldon Matplotlib's defaults are a bit inconvenient, but it's there: i.sstatic.net/FU6gO.png I don't make "fancy plots" for raw data, until I can figure out how to get Matplotlib to place the exponents more prominently, we're stuck with the defaults. $\endgroup$
    – uhoh
    Commented Nov 27, 2018 at 5:27
  • 1
    $\begingroup$ Ah, I see now. You should put a snippet of the raw (.xml) data in the question, as that's the source of the question. $\endgroup$
    – DrSheldon
    Commented Nov 27, 2018 at 6:19
  • $\begingroup$ @DrSheldon done! $\endgroup$
    – uhoh
    Commented Nov 27, 2018 at 6:25

1 Answer 1

3
$\begingroup$

The XML shows downlink frequencies as a high-precision number in Hz and uplink as a round number in MHz. It's not stated explicitly in the XML, but that's the pattern. There's some logic to that choice:

  • uplinks can be done at a fixed frequency (except when your receiver has a fault that requires exact transmissions, see Huygens).
  • for downlinks you get a Doppler shift which you want to quantify in as much precision as you can (because it contains information)
$\endgroup$
3
  • $\begingroup$ This explanation of the difference between the up and down linked frequency formats makes total sense, thank you! It's a partial answer though, for the up/down powers I think we'll need a reference. $\endgroup$
    – uhoh
    Commented Nov 28, 2018 at 14:40
  • 1
    $\begingroup$ haven't found a reference yet. $\endgroup$
    – Hobbes
    Commented Nov 28, 2018 at 14:50
  • $\begingroup$ this answer bodes ill for finding one. $\endgroup$
    – uhoh
    Commented Dec 4, 2018 at 0:48

Your Answer

By clicking “Post Your Answer”, you agree to our terms of service and acknowledge you have read our privacy policy.

Not the answer you're looking for? Browse other questions tagged or ask your own question.