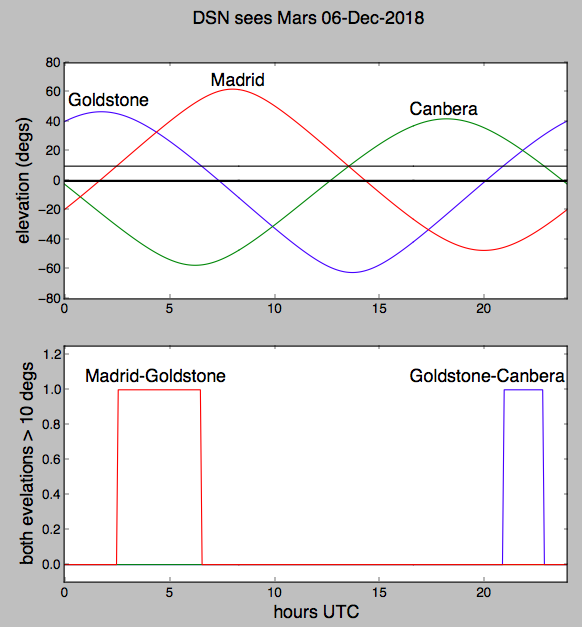
Here is a quick answer for today. It varies as Earth and Mars move in their orbits. This script can be adjusted to other dates or bodies.
I've used the Python package Skyfield but you can extract the same elevation angles from Horizons, they both are using one of the late Development Ephemerides
Today Madrid-Goldstone have about 4 hours of observing with Mars 10 degrees above the horizon, and Goldstone-Canbera have a little less than 2 hours. Next week or next month it will be different.
10 degrees is an arbitrary limit and usually one would like to be higher than that. I have not checked about hardware limits. Both the sky noise increases and side lobes will pick up more ground noise (both are thermal noise) as you get closer to the horizon. Would be worse for a very weak signal in very deep space like the Voyagers or New Horizons.
For more on noise see the DESCANSO series document Low-Noise Systems in the
Deep Space Network
From Horizons
Use this pattern or similar, use ftp or save to disk right from the web page:

From Python/Skyfield

class Site(object):
    def __init__(self, name, latlon):
        self.name   = name
        self.latdeg = latlon[0]
        self.londeg = latlon[1]

info  = (('Goldstone', (35.426667, -116.89)), ('Madrid', (40.429167, -4.249167)),
         ('Canbera', (-35.401389, 148.981667)))

import numpy as np
import matplotlib.pyplot as plt
from skyfield.api import Topos, Loader, EarthSatellite

halfpi, pi, twopi = [f*np.pi for f in (0.5, 1, 2)]
degs, rads = 180/pi, pi/180

load    = Loader('~/Documents/fishing/SkyData')  # avoids multiple copies of large files

data    = load('de421.bsp')
earth   = data['earth']
mars    = data['mars']
ts      = load.timescale()

print earth.at(ts.now()).position.km   # for no reason at all

hours    = np.linspace(0, 24, 24*12+1)  # 24 hours in 5 minute steps
time     = ts.utc(2018, 12, 6, hours)   # 2018-12-6

sites = [Site(*thing) for thing in info]
Goldstone, Madrid, Canbera = sites

for site in sites:
    site.topo = earth + Topos(longitude_degrees=site.londeg,
                              latitude_degrees =site.latdeg )
    alt, az, dist  = site.topo.at(time).observe(mars).apparent().altaz()
    site.elevation = alt.radians
    site.azimuth   = az.radians

pairs     = [(sites[i%3], sites[(i+1)%3]) for i in range(3)]
pairnames = [(a.name, b.name) for (a, b) in pairs]

if True:
    plt.figure()
    fs = 16

    plt.subplot(2, 1, 1)

    for site in sites:
        plt.plot(hours, degs*site.elevation)
    plt.plot(hours, np.zeros_like(hours), '-k', linewidth=2)
    plt.plot(hours, 10+np.zeros_like(hours), '-k', linewidth=1)
    plt.text( 0.2, 51, 'Goldstone', fontsize=fs)
    plt.text( 7.0, 65, 'Madrid', fontsize=fs)
    plt.text(16.5, 45, 'Canbera', fontsize=fs)
    plt.xlim(0, 24)
    plt.ylabel('elevation (degs)', fontsize=fs)

    plt.subplot(2, 1, 2)

    for s0, s1 in pairs:
        ok = (degs * s0.elevation > 10) & (degs * s1.elevation > 10)
        plt.plot(hours, ok)
    plt.ylim(-0.1, 1.25)
    plt.xlabel('hours UTC', fontsize=fs)
    plt.ylabel('both evelations > 10 degs', fontsize=fs)
    plt.xlim(0, 24)

    plt.text( 1,   1.05, 'Madrid-Goldstone', fontsize=fs)
    plt.text(16.5, 1.05, 'Goldstone-Canbera', fontsize=fs)

    plt.suptitle('DSN sees Mars 06-Dec-2018', fontsize=fs)
    plt.show()
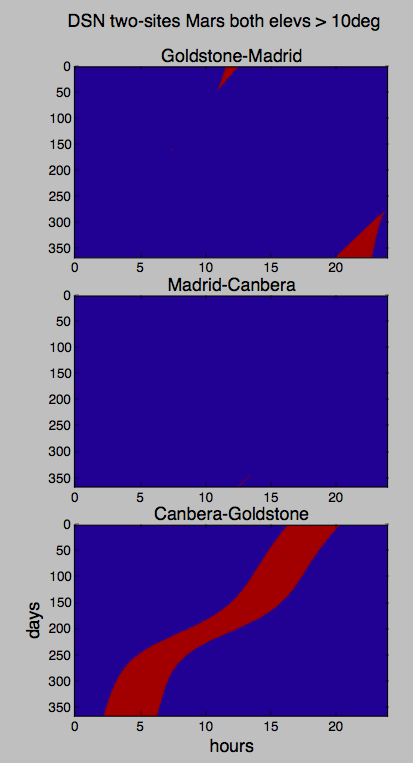
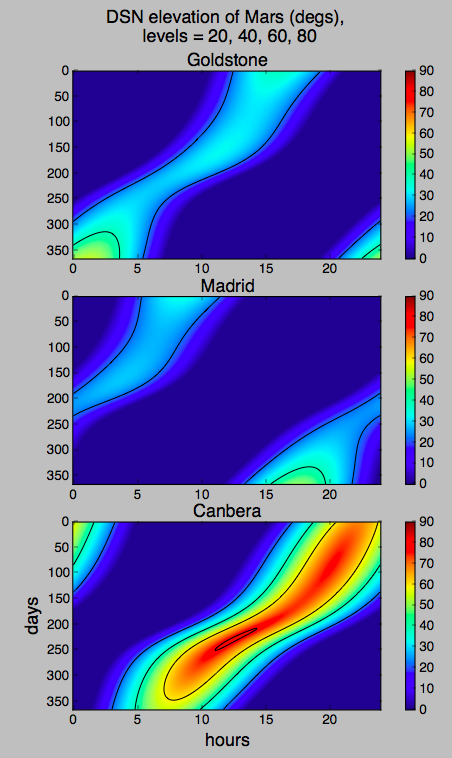
update: Here is the calendar year 2018. The Boolean plots are the envelopes for Mars elevation at both sites above 10 degrees. The color plots are Mars elevation angle for each site.


class Site(object):
    def __init__(self, name, latlon):
        self.name   = name
        self.latdeg = latlon[0]
        self.londeg = latlon[1]

info  = (('Goldstone', (35.426667, -116.89)), ('Madrid', (40.429167, -4.249167)),
         ('Canbera', (-35.401389, 148.981667)))

import numpy as np
import matplotlib.pyplot as plt
from skyfield.api import Topos, Loader, EarthSatellite

halfpi, pi, twopi = [f*np.pi for f in (0.5, 1, 2)]
degs, rads = 180/pi, pi/180

load    = Loader('~/Documents/fishing/SkyData')  # avoids multiple copies of large files

data    = load('de421.bsp')
earth   = data['earth']
mars    = data['mars']
ts      = load.timescale()

print earth.at(ts.now()).position.km   # for no reason at all

hours    = np.linspace(0, 24, 24*12+1)  # 24 hours in 5 minute steps
days     = np.arange(0, 367, 2)

sites = [Site(*thing) for thing in info]
Goldstone, Madrid, Canbera = sites
names = [site.name for site in sites]

for site in sites:
    site.topo = earth + Topos(longitude_degrees=site.londeg,
                              latitude_degrees =site.latdeg )

pairs     = [(sites[i%3], sites[(i+1)%3]) for i in range(3)]
pairnames = [(s0.name, s1.name) for (s0, s1) in pairs]


big_okays = []
big_elevs = []
for day in days:
    time     = ts.utc(2018, 1, day, hours)   # 2018-12-6

    elevs = []
    for site in sites:
        site.topo = earth + Topos(longitude_degrees=site.londeg,
                                  latitude_degrees =site.latdeg )
        alt, az, dist  = site.topo.at(time).observe(mars).apparent().altaz()
        site.elevation = alt.radians
        site.azimuth   = az.radians
        elevs.append(np.maximum(0, site.elevation))
    big_elevs.append(elevs)

    okays = []
    for s0, s1 in pairs:
        ok = (s0.elevation > rads*10) & (s1.elevation > rads*10)
        okays.append(ok)

    big_okays.append(okays)

big_okays = np.array(big_okays)
new_okays = np.moveaxis(big_okays, 1, 0)

big_elevs = np.array(big_elevs)
new_elevs = np.moveaxis(big_elevs, 1, 0)

if True:
    xlims = [hours[0], hours[-1]]
    ylims = [days[0],  days[-1]]
    ylims = [days[-1],  days[0]]
    extent = sum([xlims, ylims], [])
    plt.figure()
    for i, (ok, pnames) in enumerate(zip(new_okays, pairnames)):
        plt.subplot(3, 1, i+1)
        plt.imshow(ok, origin='upper', extent=extent, aspect=1./25)
        title = '{}-{}'.format(*pnames)
        plt.title(title, fontsize=16)
    if i == 2:
        plt.xlabel('hours', fontsize=16)
        plt.ylabel('days', fontsize=16)
    plt.suptitle('DSN two-sites Mars both elevs > 10deg', fontsize=16)
    plt.show()

if True:
    xlims  = [hours[0], hours[-1]]
    ylims  = [days[0],  days[-1]]
    ylims  = [days[-1],  days[0]]
    extent = sum([xlims, ylims], [])
    levels = [20, 40, 60, 80]
    plt.figure()
    for i, (elev, name) in enumerate(zip(new_elevs, names)):
        plt.subplot(3, 1, i+1)
        plt.imshow(degs*elev, origin='upper', extent=extent,
                   vmin=0, vmax=90, aspect=1./25)
        plt.colorbar()
        plt.contour(degs*elev, levels=levels, extent=extent,
                    origin='upper', colors='k', aspect=1./25)
        title = '{}'.format(name)
        plt.title(title, fontsize=16)
    if i == 2:
        plt.xlabel('hours', fontsize=16)
        plt.ylabel('days', fontsize=16)
    plt.suptitle('DSN elevation of Mars (degs), \n levels = 20, 40, 60, 80',
                 fontsize=16)
    plt.show()


