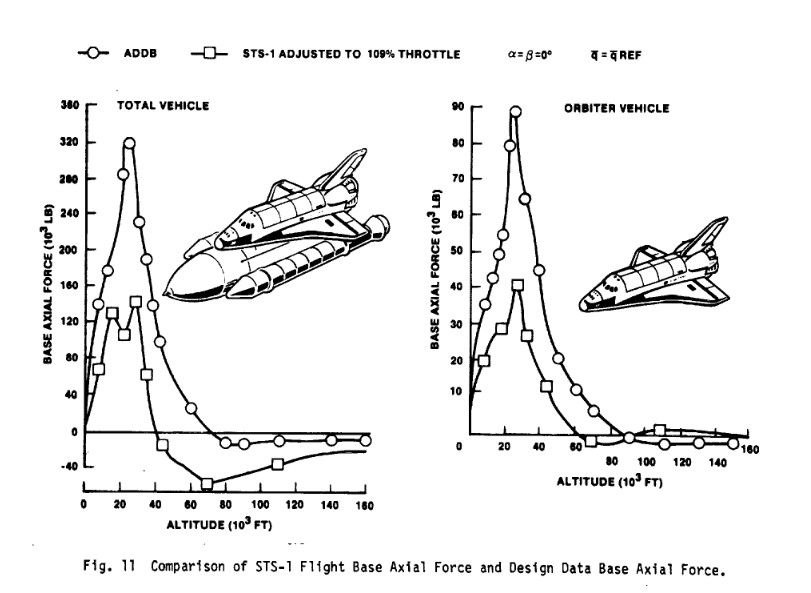
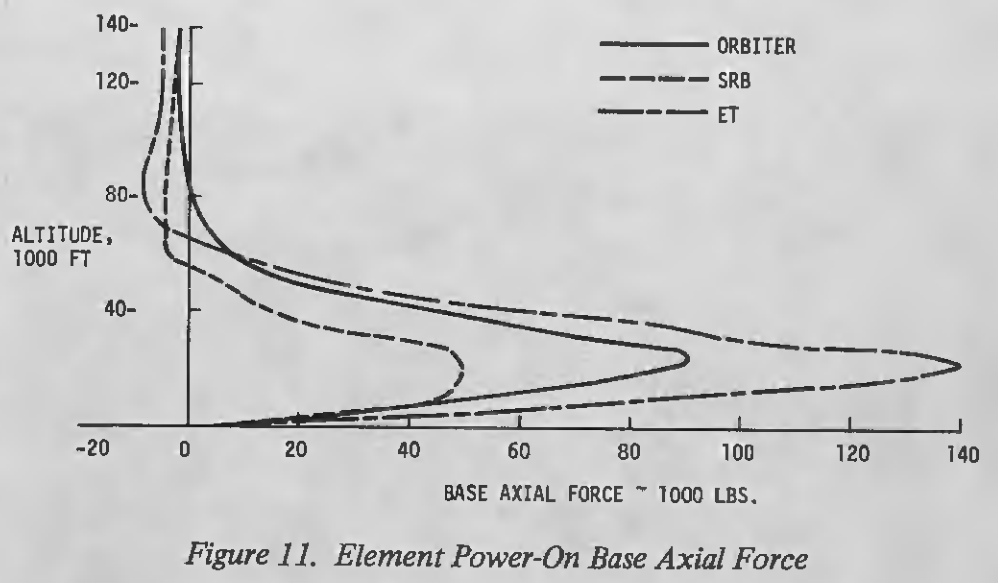
This graph shows the "base force" which is a force produced by pressure differential due to propulsion plume effects acting on the vehicle.
This effect was poorly predicted in tests and calculations prior to the first mission and resulted in STS-1 lofting quite a bit more than expected in first stage.
Columbia went through maximum dynamic pressure (606 psf) at Mach 1.06
and 26.5 KFT. SRB separation occurred 120 seconds into flight at Mach
3.88 and 174,000 feet; 10,000 feet higher than predicted. This lofting of the ascent trajectory was later attributed to unmodeled
plume-induced aerodynamic effects in the Orbiter and ET base region.
Source
This is discussed in the paper The Space Shuttle Launch Vehicle Aerodynamic Verification Challenges in Space Shuttle Technical Conference Volume 1. They show this graph of predicted vs actual base force.

Based on Figure 5 in the same document, it appears the the X axis used here points positive towards the rear of the vehicle. So the positive forces shown early in the flight are actually retarding the vehicle, and the negative ones late in flight are pushing it. This seems consistent since at first there is probably a relatively low pressure bubble behind the vehicle due to the plumes, but at altitude, that low pressure is still higher than ambient so it becomes a push.
The predicted retarding forces were higher than actual, and the predicted pushing forces were lower than actual. Hence the vehicle ending up higher than expected at SRB sep.

