**[@Rafa is right](https://space.stackexchange.com/questions/57771/does-the-james-webb-telescope-has-a-two-line-element-set?noredirect=1#comment191245_57771)**, there is at least one officially released TLE for the JWST *mission* and here's the latest one at n2yo.com:
1 50463U 21130A 21362.00000000 .00000000 00000-0 00000-0 0 9999
2 50463 4.6198 89.0659 9884983 192.3200 17.4027 0.01958082 27
But TLE's will not do a good job here.
**[@ChristopherJamesHuff is right](https://space.stackexchange.com/questions/57771/does-the-james-webb-telescope-have-a-two-line-element-set?noredirect=1#comment191246_57771)** that TLE's can't do the job here. They might reproduce the right position at epoch, but if you propagate them forward or backward they will no reproduce the trajectory or orbital motion.
### [Even a broken clock is right twice a day](https://www.goodreads.com/quotes/7197758-even-a-broken-clock-is-right-twice-a-day)
But in this case, the TLE is only right at one moment in time, if ever.
The epoch `21362.00000000` is the 362nd day of 2021, which seems to be `2021-12-28 00:00 UTC`.
[JWST launched on 25 December 2021 at 12:20 UT](https://nssdc.gsfc.nasa.gov/nmc/spacecraft/display.action?id=2021-130A) so this is about two and a half days after launch; and therefore it would be in deep space already and not orbiting the Earth.
### And yet, there was still a TLE issued!
Let's see what it says:
With a mean motion of `0.01958082` Earth orbits per day this TLE is trying to say that it's at least in a very high orbit. In reality it was no longer bound to Earth or in Earth orbit at this time, so it's not right.
$$T = 2 \pi \sqrt{\frac{a^3}{GM}}$$
gives
$$a = \left( \frac{GM T^2}{4 \pi^2} \right)^{1/3}$$
and with GM = 3.986E+14 m^3/s^2 and a 51.07 day orbit that puts the semimajor axis at about 58,000 kilometers.
But with an eccentricity of `0.9884983` the predicted distance from Earth at epoch or another given moment could be almost twice $a$ or 1 percent of $a$. So we'd have to propagate it with SGP4 to find out what it's saying and how well it matches the real trajectory.
### It turns out that I'm crazy enough to do just that!
From JLP's Horizons:
date & time UTC distance (km) rate (km/s)
----------------- ---------------- -----------
2021-Dec-26 00:00 1.3369842393E+05 2.2108515
2021-Dec-26 06:00 1.7778266287E+05 1.9034419
2021-Dec-26 12:00 2.1651707751E+05 1.6961163
2021-Dec-26 18:00 2.5157752082E+05 1.5470824
2021-Dec-27 00:00 2.8371359651E+05 1.4329090
2021-Dec-27 06:00 3.1363829802E+05 1.3408820
2021-Dec-27 12:00 3.4175065486E+05 1.2642573
2021-Dec-27 18:00 3.6833557041E+05 1.1988998
2021-Dec-28 00:00 3.9360502697E+05 1.1421383
2021-Dec-28 06:00 4.1777927226E+05 1.0948360
2021-Dec-28 12:00 4.4093726644E+05 1.0502208
2021-Dec-28 18:00 4.6318106793E+05 1.0100482
2021-Dec-29 00:00 4.8459829675E+05 0.9735797
2021-Dec-29 06:00 5.0526046491E+05 0.9402252
2021-Dec-29 12:00 5.2523381459E+05 0.9095617
2021-Dec-29 18:00 5.4457084676E+05 0.8812288
2021-Dec-30 00:00 5.6331803317E+05 0.8549237
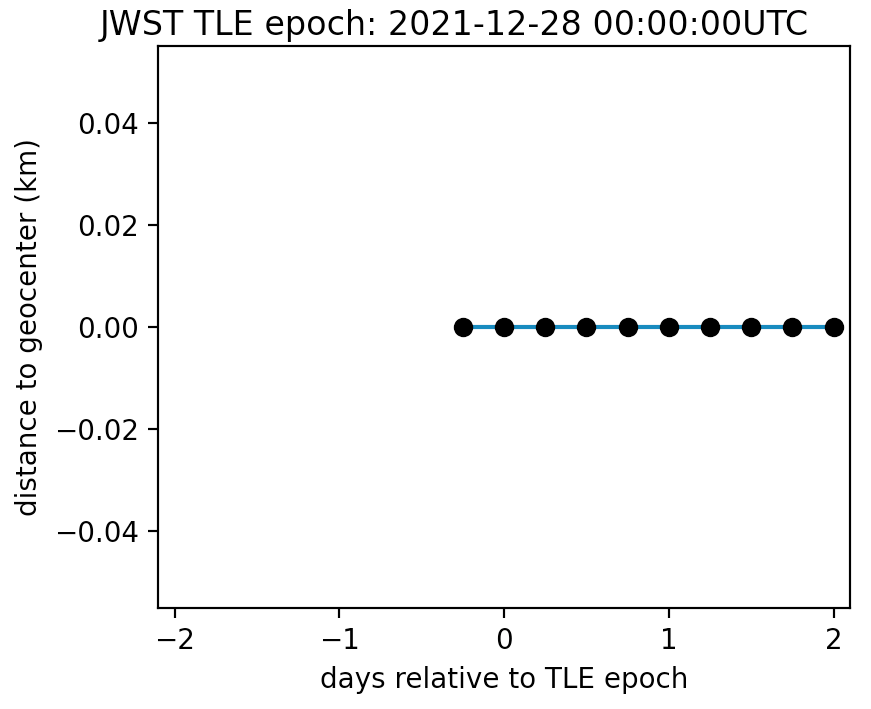
From [Skyfield](https://rhodesmill.org/skyfield/): uhoh!
Right now it looks like this TLE is so unphysical that it's outside of Skyfield version 1.41's ability to interpret. Stay tuned, since n2yo can do it, some newer version of Skyfield might be able to as well.
In the mean time I've asked https://space.stackexchange.com/q/57821/12102
array([nan, nan, nan, nan, nan, nan, nan, 0., 0., 0., 0., 0., 0.,
0., 0., 0., 0.])
[](https://i.sstatic.net/iihpV.png)
import numpy as np
import matplotlib.pyplot as plt
from skyfield.api import load, EarthSatellite, Loader, wgs84
import datetime
loaddata = Loader('~/Documents/fishing/SkyData') # avoids multiple copies of large files
ts = loaddata.timescale() # include builtin=True if you want to use older files (you may miss some leap-seconds)
eph = loaddata('de421.bsp') # a small one, fine for this
L1, L2 = """1 50463U 21130A 21362.00000000 .00000000 00000-0 00000-0 0 9999
2 50463 4.6198 89.0659 9884983 192.3200 17.4027 0.01958082 27""".splitlines()
sat = EarthSatellite(L1, L2)
days = np.arange(17)/4. - 2. # +/- 2 days in 6 hour increments
times = ts.tt_jd(sat.epoch.tt + days)
epoch_string = datetime.datetime(*sat.epoch.utc[:5]).isoformat().replace('T', ' ') + 'UTC'
print('+/- 2 days around epoch of: ', epoch_string)
g = sat.at(times) # geocentric position object
p = g.position.km # geocentric positions (km)
d = g.distance().km
if True:
fig, ax = plt.subplots(1, 1)
ax.plot(days, d)
ax.plot(days, d, 'ok')
ax.set_xlim(days.min() - 0.1, days.max()+0.1)
ax.set_xlabel('days relative to TLE epoch')
ax.set_ylabel('distance to geocenter (km)')
ax.set_xlabel('days relative to TLE epoch')
plt.suptitle('JWST TLE epoch: ' + epoch_string)
plt.show()