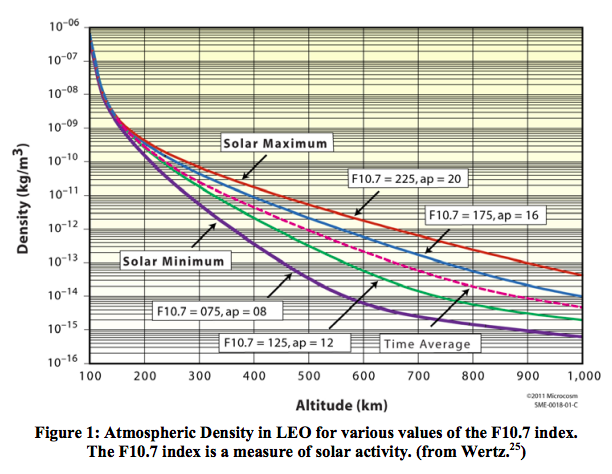
What is the density of the earth's atmosphere at an altitude of four hundred kilometers?
Variation with solar activity
It can vary by a factor of 50 depending on solar activity (and the model that you choose to believe).
Here are good references.
- Robert A. Braeunig's 2014 website Atmospheric Models (mentioned here while I was writing this)
- NASA's Earth Atmosphere Model tutorial
- NASA Technical Memorandum TM-X-74335 U.S. Standard Atmosphere, 1976
- The Jacchia Reference Atmosphere found in this answer
One or more of these gives pressure and temperature rather than density. You can assume that at 400 km (and somewhat below and above it) the atmosphere is primarily atomic oxygen (mass = 16 not 32) to get density using the ideal gas law.
Note that you can get quite a range of densities depending on the solar activity specified. This answer to What is the ISS drag? shows altitude loss rate for the ISS varying from 7 m/day to 400 m/day depending on solar activity.
From this answer to What orbit would a space station need to stay in orbit for N years?:
Found in this answer, from https://en.wikipedia.org/wiki/Scale_height Wertz et al. SSC12-IV-6, 26th Annual AIAA/USU Conference on Small Satellites.
Diurnal (daily) variation
Hat-tip to @Peter-ReinstateMonica for pointing this out.
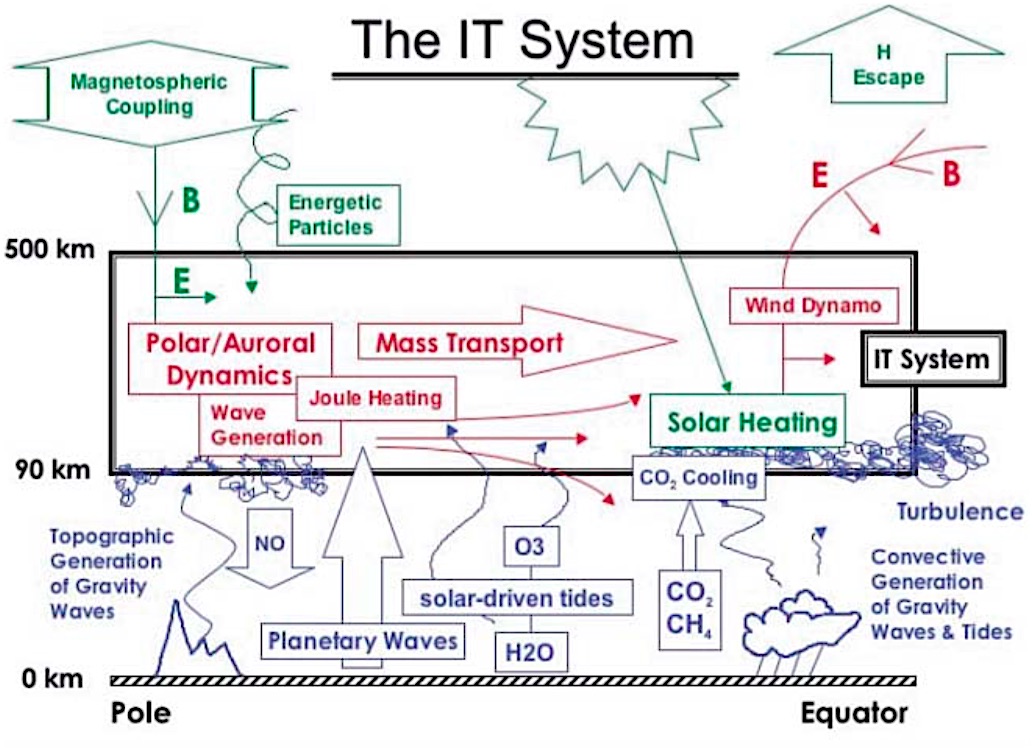
There is definitely a diurnal component to the temperature of the thermosphere and that will lead to changes in density, and this even drives diurnal tides, but it's complicated (see Figure 1 below).
However since orbit decay is a slow process, we primarily worry about some kind of average density experienced over a given orbit. An equatorial orbit in LEO will sample roughly 15 day/night cycles per day, a Sun-synchronous orbit might sample 15 dawn/dusk cycles per day.
From "Dynamics of the Thermosphere", Jeffrey M. FORBES, Journal of the Meteorological Society of Japan, Vol. 85B, pp. 193--213, 2007
Fig. 1. Energy input, conversion and transport processes relevant to the Ionosphere-Thermosphere (IT) system. Green indicates energy sources from above the thermosphere, blue indicates influences of lower atmospheric regions on the thermosphere, and red indicates energy conversion and transport processes within the thermosphere.
For further reading see also:
- Which LEO satellite lost over 30 km of altitude in the geomagnetic storm of 13-14 March 1989?
- How hard does atmospheric drag push on the ISS? Is it more than one pound?
- How steady is the atmospheric drag force experienced by the ISS?
- Where can I find data for Atmospheric density vs. altitude?
- What caused the ISS's sudden loss of altitude in January 2015?

