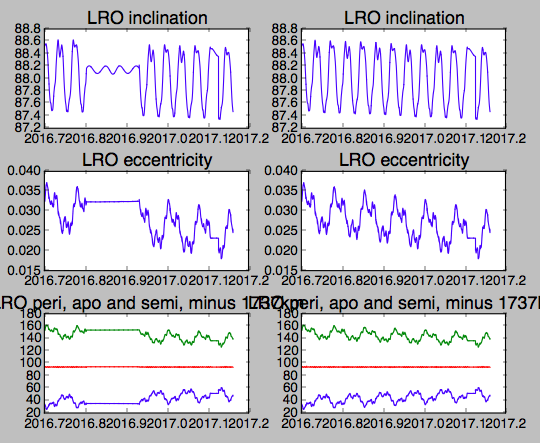
Based on some very helpful replies from Jon Giorgini at JPL and a bit of additional reading, I can summarize as follows:
The actual calculation of spacecraft orbits, combining both the effects of gravity and other forces in the Solar System plus orbital maneuvers of the spacecraft itself are combined/reconciled with available radar and telemetry. The result is of course the state vector table.
The osculating elements are derived from the state vectors for convenience only. They are not intended as primary sources of orbit data, and each set of points is only intended to be used to define the position of the spacecraft at that point in time.
For a short period of time while waiting for either more data, or a decision about an upcoming maneuver, an alternate algorithm for the osculating elements seems to have been applied to a short span of dates, resulting in a smoother appearance of some of the plots.
This does not mean they are necessarily less accurate in position, because the elements are only ever intended to be used to define the position near the moment for which they are calculated. The spacectraft's true orbit is not really a conic section at all to begin with, especially considering the complicated gravity field of the Earth-Moon system.
Following the updated calculation, the appearance is back to expected, though this still equally valid.
As for the periodic variations themselves: The monthly and bi-monthly periodicities are manifestations of the reality of orbiting the lumpy gravitational field of the moon under the gravitational effects of the Earth. Since the Moon's orbit is significantly elliptical rather than circular, that strongly perturbing effect is periodic. These effects are made particularly visible in these plots because they are not simple Keplerian orbits to begin with, and trying to express them as such will highlight the difference.
Below is a quick comparison of the derived osculating elements before and after the regularly scheduled update. All is well.
