10
$\begingroup$

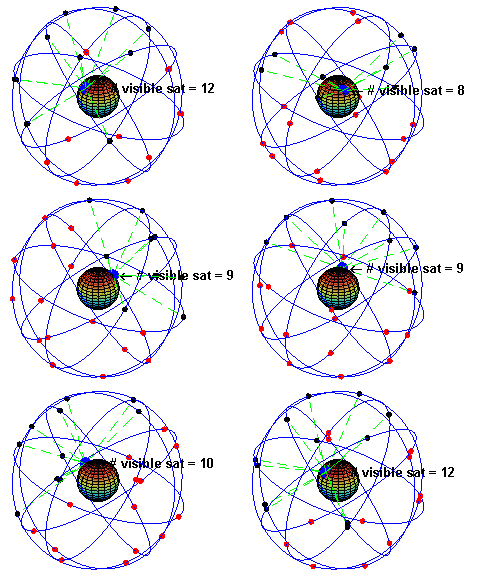
Through the extremely rigorous method of looking at the animation on Wikipedia's article about GPS, if this does indeed accurately represent GPS satellite orbits, then it looks like not all of the orbital planes are at the same inclination.

In trying to look this up online, I see a lot of articles that talk about GPS satellites being at 55 degrees inclination. I know that the GPS constellation has evolved over time, so maybe this isn't the general case anymore.

For something to be in a Walker Delta configuration, all of the orbits have to have the same inclination. So my question, do all GPS satellites have the same inclination? And do they exist in a Walker Delta configuration?

$\endgroup$

2 Answers 2

18
$\begingroup$

I only had a quick look but the answer seems to be:

do all GPS satellites have the same inclination?

The intention is yes, the reality is no (small variations)

And do they exist in a Walker Delta configuration?

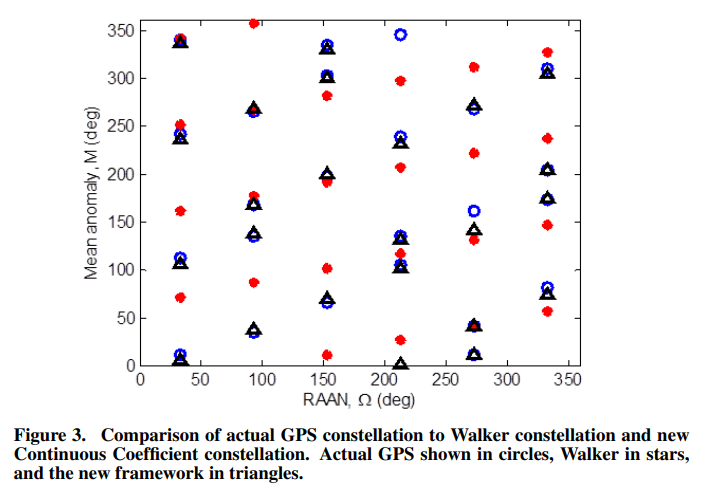
They started with a Walker constellation and then the distribution of mean anomalies of all satellites were independently optimized

TL;DR:

The initial GPS constellation consisted of concept validation block I satellites launched into three 63° inclined orbital planes.

Hence, the comparative analysis based on the current constellation of six orbital planes with a 55° inclination used only satellites of block II and later.

In the nominal form of the GPS space segment, the orbital planes are distributed symmetrically and separated by about 60° on the equator.

The satellite orbit parameters achieved for each launch are never perfect and deviate from nominal values within certain limits.

For instance, SPS informs that the achieved orbit inclination for any specific GPS satellite can be anywhere within 3° of the nominal inclination of 55°.

The time derivative of the longitude of the ascending node (Ω) is a function of the achieved orbit inclination and orbit semi-major axis.

As the GPS control segment does not remain passive due to changes in the constellation of satellites, some constellation tolerances and management practices need to be indicated.

From time to time, orbit adjustments (thrusts) are performed to manage the constellation. Orbit maneuvers require a pause in the satellite mission as they cause discontinuities in the satellite track.

enter image description here

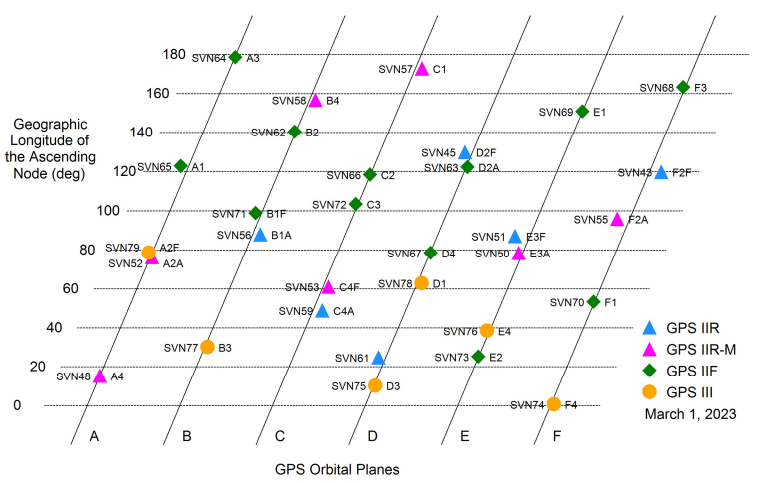
A depiction of the GPS constellation of satellites with slot and plane designations

During the GPS modernization process, the orbital configuration, as indicated by the constellation slant chart, and control station configuration may not match over the long term. For modelling purposes, the slant chart indicates actual orbital slot and plane assignments.

Further:

The constellation design started with a Walker constellation and then the distribution of mean anomalies of all satellites were independently optimized.

This optimization process led to a very non-uniform design

enter image description here

Due to the perturbations in the movement of GPS satellites and the modernization of the space segment occurring in the 24-year research timeframe, the position of six OP ANs did not meet the theoretical division of the full angle into six equal parts.

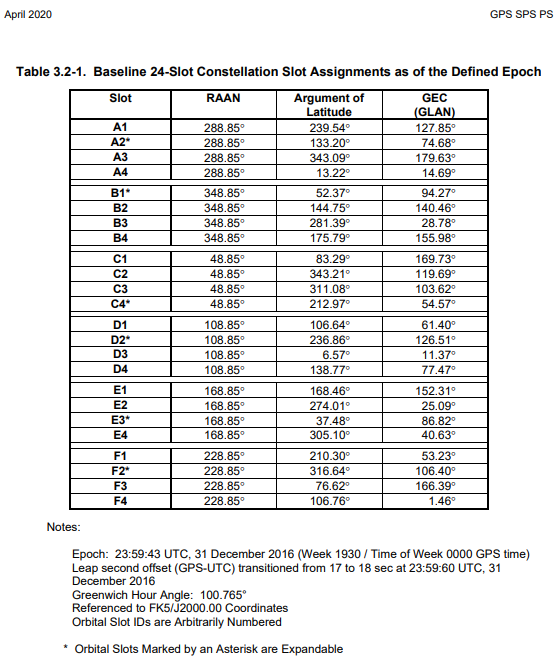
enter image description here

Note that the actual satellite RAAN values will vary from the nominal values in Table 3.2-1 and Table 3.2-2 due to initial launch dispersion, perturbation forces acting over each satellite's lifetime (particularly the inclination-dependent forces due to the Earth’s geopotential oblateness [J2 term]), and variations in other forces affecting each unique satellite orbit nodal regression rate. Maintenance of the satellite argument of latitude (ArgLat) values and relative spacing of the slots are the controls employed to compensate for orbit plane drift and sustain constellation geometry at acceptable levels. It is also possible for the inclination to drift out of the operational range.

Also:

The first GPS constellation was a Walker constellation with 18 satellites in 3 planes, inclined to 55°.

Although this pattern guaranteed worldwide continuous coverage by at least 4 satellites, it proved to be too sensitive to satellite failures. Thus, three spare satellites were added, one in each orbital plane, obtaining a configuration with 21 spacecraft in 3 orbital planes.

Then, extensive computations with 1, 2 and 3 satellite failures led to the current constellation of 24 satellites in 6 planes characterized by an inclination of approximately 55°.

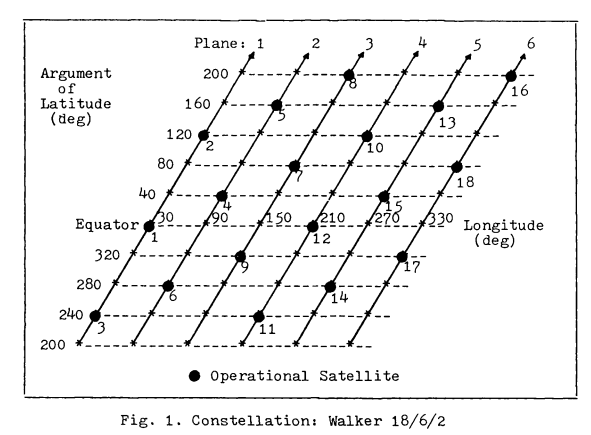
This was the original 18 satellite configuration design -

Constellation: Walker 18/6/2

enter image description here

This configuration has the minimum (18) acceptable number of satellites for satisfactory system performance. The constellation is comprised of six orbital planes separated by 60 degrees of longitude. There are three satellites uniformly spaced in each plane with 120 degrees of separation between adjacent satellites. Plane to plane phasing is 40 degrees. Each satellite has another satellite in the plane to the east 40 degrees ahead of it in orbit. (Ref.: 1985)

https://www.mdpi.com/2072-4292/13/3/387

https://www.researchgate.net/publication/289699816_Reducing_Walker_Flower_and_streets-of-doverage_constellations_to_a_single_constellation_design_framework/link/58501f9b08aecb6bd8d20e04/download

https://www.gps.gov/technical/ps/2020-SPS-performance-standard.pdf

https://issfd.org/ISSFD_1999/pdf/CO1_3.pdf

https://apps.dtic.mil/sti/tr/pdf/ADA152030.pdf

$\endgroup$
8
$\begingroup$

Partial answer only to address the apparent inclinations in the image

(refer to @blobbymcblobby's thorough answer and others if posted for the rest)

Through the extremely rigorous method1 of looking at the animation on Wikipedia's article about GPS, if this does indeed accurately represent GPS satellite orbits, then it looks like not all of the orbital planes are at the same inclination.

1I see what you did there :-)

The author of the image does appear to try to have illustrated six planes at the same inclination of 55° spaced at 60° intervals. However the notes that come with the illustration don't mention how the lines of apses for the 0.05 eccentricities were oriented.

A simulation of the original design of the GPS space segment, with 24 GPS satellites (4 satellites in each of 6 orbits), showing the evolution of the number of visible satellites from a fixed point (45°N) on earth (considering "visibility" as having direct line of sight).

The parameters used to simulate the orbits are: eccentricity (e) 0.05, inclination (i) 55° and a separation between orbits of 60° in the right ascension of the ascending node. Within each orbit, the four satellites are evenly spaced (the instant of pass through perihelion being arbitrary for the first satellite in each orbit). The orbital period of the satellites was taken to be 12 hours. The earth was considered a perfect sphere with a radius of 6400 km.

The time in the animation is running about 2880 times faster than real time (half a minute representing 24 hours), as clearly seen in the rotation of earth. The simulation was created using MATLAB and converted to animated gif format using Adobe ImageReady.

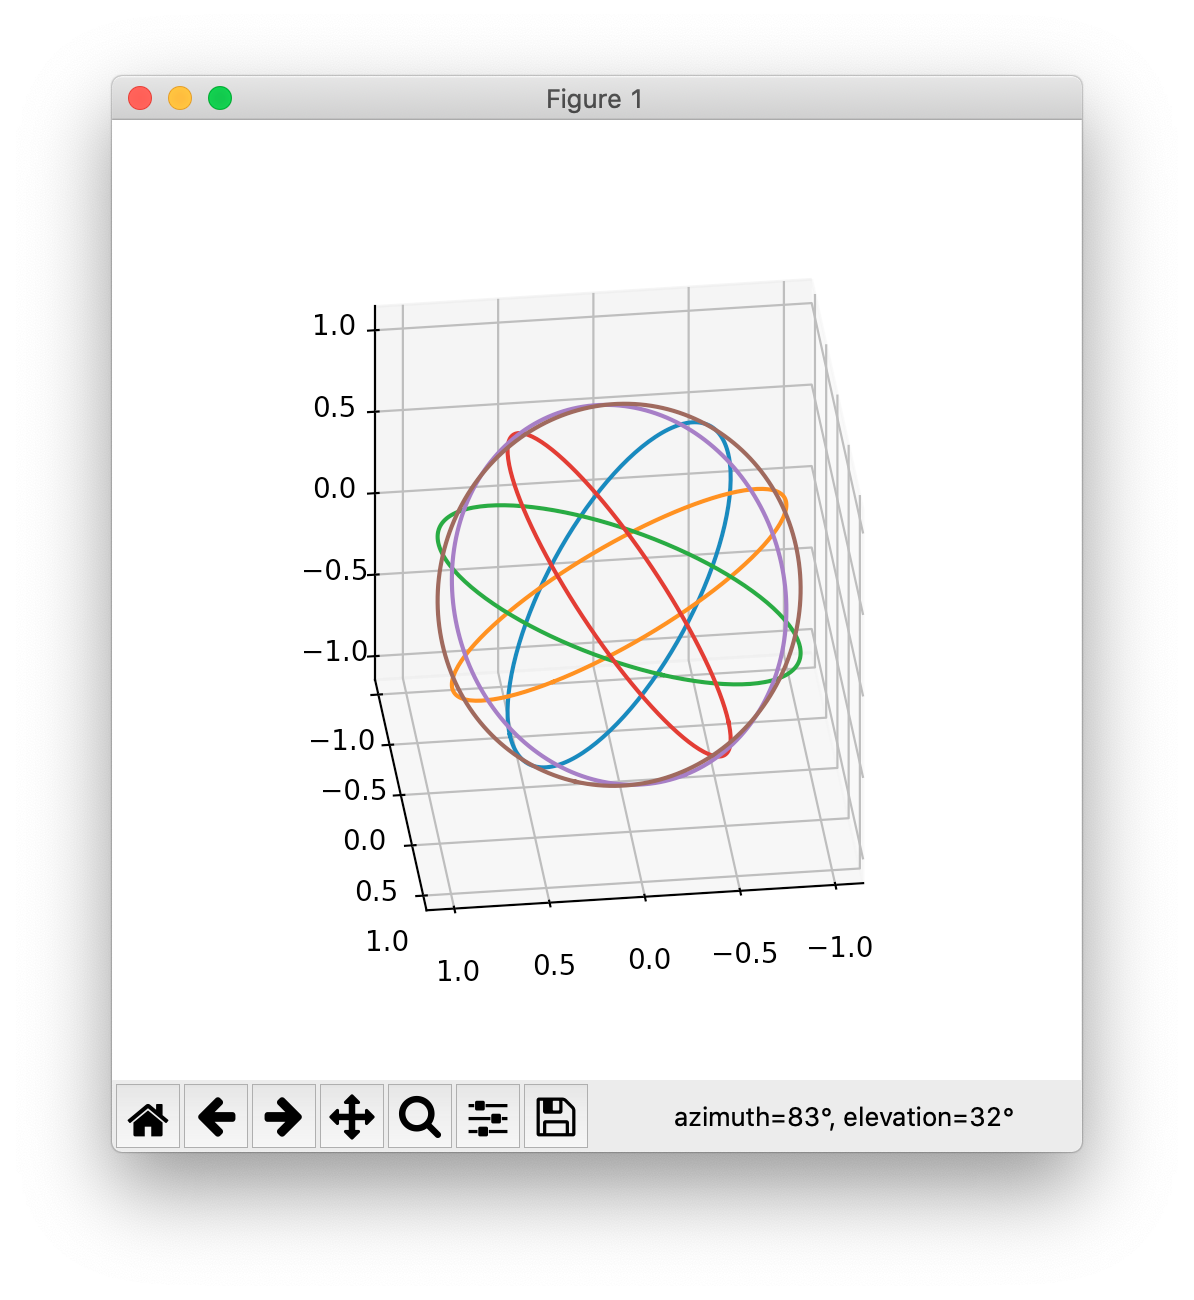
Using just six circular orbits with 55° inclination spaced at 60° intervals I can already get pretty close to the same pattern. Since there's no information on the lines of apses, I didn't try to add eccentricity.

Therefore if the image does not appear to represent six 55° inclined orbital planes spaced at 60°, it still might, but either the placements of the little dots (RAANs) or the eccentricities and lines of apses may be throwing you off.

enter image description here source


six 55° inclined orbits, spaced at 60° oriented to roughly match the Wikimedia GIF

Python script:

import numpy as np
import matplotlib.pyplot as plt
from mpl_toolkits.mplot3d import Axes3D

points = np.linspace(0, 2*np.pi, 201)

equatorial_orbit = np.array([f(points) for f in (np.cos, np.sin, np.zeros_like)])

inclination = 55

sin, cos, one, zero  = [f(np.radians(inclination)) for f in
                        (np.sin, np.cos, np.ones_like, np.zeros_like)]

rot_about_y = np.array([[cos, zero, sin], [zero, one, zero], [-sin, zero, one]])

orbit_tilted_about_y = (rot_about_y[..., None] * equatorial_orbit).sum(axis=1)

orbits = []

for rotation in 60 * np.arange(6):
    
    sin, cos, one, zero  = [f(np.radians(rotation)) for f in
                            (np.sin, np.cos, np.ones_like, np.zeros_like)]

    rot_about_z = np.array([[cos, sin, zero], [-sin, cos, zero],
                            [zero, zero, one]])
    
    orbit_rotated = (rot_about_z[..., None] * orbit_tilted_about_y).sum(axis=1)

    orbits.append(orbit_rotated)

fig = plt.figure()
ax = fig.add_subplot(1, 1, 1, projection='3d', proj_type = 'ortho')

for x, y, z in orbits:
    ax.plot(x, y, z)

ax.set_xlim(-1.1, 1.1)
ax.set_ylim(-1.1, 1.1)
ax.set_zlim(-1.1, 1.1)
ax.set_box_aspect([1,1,1])
# https://stackoverflow.com/a/68242226/3904031

ax.view_init(elev=45, azim=0)

plt.show()
$\endgroup$

Your Answer

By clicking “Post Your Answer”, you agree to our terms of service and acknowledge you have read our privacy policy.

Not the answer you're looking for? Browse other questions tagged or ask your own question.