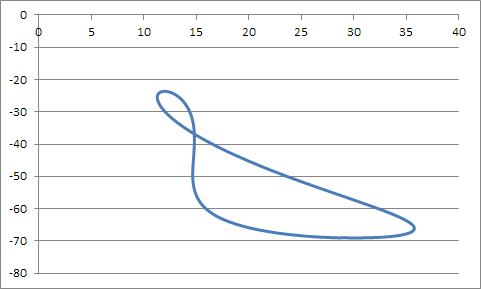
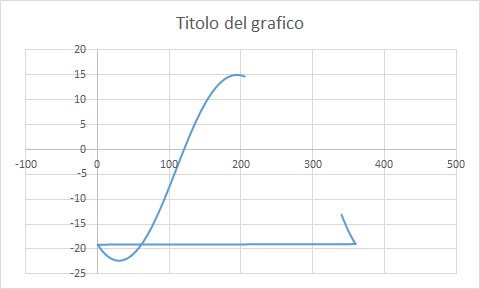
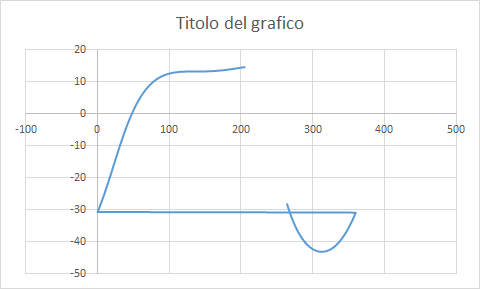
I tried to replicate these analemmas, taken from a discussion of the equation of time in the following post: http://pbarbier.com/eqtime/eqtime.html:
I used "Quantity n.4" for Nasa Horizons (apparent Alt/Az from planet surface):
http://win98.altervista.org/space/exploration/NHUGUI.html
Link for Mars data: link
For Earth I get quite good results (at least, it's an 8-shaped curve...):
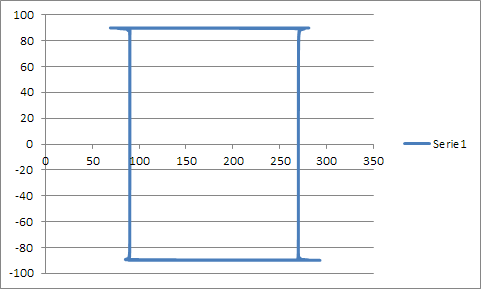
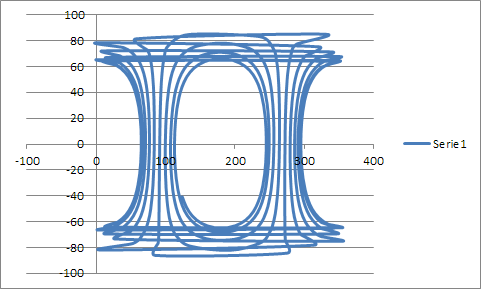
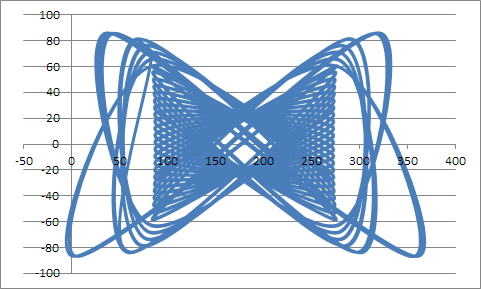
But look at what I get for other planets!
Possibly I should use proper STEP_SIZE input parameter for each planet, to get one result/line per each local day ("Sol" or wtahever), but trying 1477 and 1478 (*) for Mars gives two totally different plots, both different from "reference" plot above.
Possibly I should also specify proper year duration in the Horizon query (687 Earth days for Mars), but this shouldn't affect the shape of the plot, but just if the plot is complete or not.
(*) A Martian day lasts 88642.663 Earth seconds, i.e. 1.477,37771666 Earth minutes, but Horizons does not accept seconds as STEP_SIZE input, neither it accepts decimal values for minutes.
Further data:
Day durations:
- Mercury: 58d 15h 30m = 84450 min
- Venus: 116d 18h 0m = 168120 min
- Mars: 1d 0h 37m = 1477 min
- Jupiter: 0d 9h 56m = 596 min
- Saturn: 0d 10h 42m = 642 min
- Uranus: 0d 17h 14m = 1034 min
- Neptun: 0d 16h 6m = 966 min

