It could have almost been an Apollo astronaut!
but only during 1969-1972, and it wasn't.
I think I can rule it out conclusively.
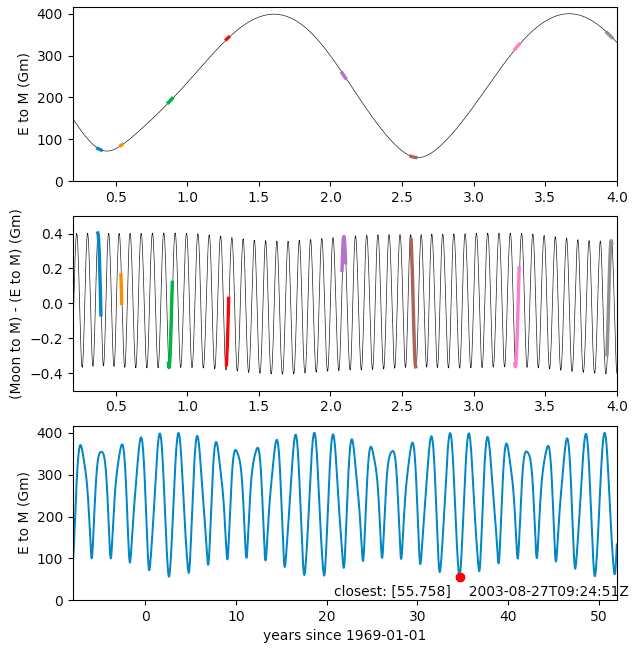
55.758 million km on 2003-08-27 is the closest the Earth has been to Mars since 1961. No trip to the Moon got closer.
I took Apollo 10 through 17 dates and plotted them on the distances of Earth to Mars, and to the difference between Moon to Mars and Earth to Mars just for fun.
I thought I'd try to simply look at actual data.
There is no chance that an astronaut got closer to Mars during an Apollo mission than Earth itself did since 1961.
hastily and poorly-written Python script:
from skyfield.api import Topos
from skyfield.api import Loader
import numpy as np
import matplotlib.pyplot as plt

from skyfield.api import load
loaddata = Loader('~/Documents/fishing/SkyData')  # avoids multiple copies of large files

ts = loaddata.timescale() # include builtin=True if you want to use older files (you may miss some leap-seconds)
eph = loaddata('de421.bsp')

earth, moon, mars = [eph[x] for x in ('earth', 'moon', 'mars')]

apollos = [(10, 1969, 5, 18, 26), (11, 1969, 7, 16, 18),
           (12, 1969, 11, 14, 24), (13, 1970, 4, 11, 17),
           (14, 1971, 1, 31, 40), (15, 1971, 7, 26, 38),
           (16, 1972, 4, 16, 27), (17, 1972, 12, 7, 19)]
# https://en.wikipedia.org/wiki/Apollo_program

timez_apollo = []
for n, year, month, d_start, d_stop in apollos:
    times = ts.utc(year, month, range(d_start, d_stop+1))
    timez_apollo.append(times)

days = 1 + np.arange(5*365.2564+1)
times = ts.utc(1969, 1, days)
years = days/365.2564
t_1969 = times.tt[0]

epos, moonpos, mpos = [x.at(times).position.km for x in (earth, moon, mars)]
r_earth = np.sqrt(((epos - mpos)**2).sum(axis=0))
dr_moon = np.sqrt(((moonpos - mpos)**2).sum(axis=0)) - r_earth

fig = plt.figure()
ax1 = fig.add_subplot(3, 1, 1)
ax2 = fig.add_subplot(3, 1, 2)
ax3 = fig.add_subplot(3, 1, 3)
ax1.plot(years, r_earth/1E+06, '-k', linewidth=0.5)
ax2.plot(years, dr_moon/1E+06, '-k', linewidth=0.5)
for timez in timez_apollo:
    yearz = (timez.tt - t_1969) / 365.2564
    epoz, moonpoz, mpoz = [x.at(timez).position.km for x in (earth, moon, mars)]
    r_earthz = np.sqrt(((epoz - mpoz)**2).sum(axis=0))
    dr_moonz = np.sqrt(((moonpoz - mpoz)**2).sum(axis=0)) - r_earthz
    ax1.plot(yearz, r_earthz/1E+06, linewidth=2.5)
    ax2.plot(yearz, dr_moonz/1E+06, linewidth=2.5)
ax2.set_ylim(-0.5, 0.5)
ax1.set_xlim(0.2, 4.0)
ax2.set_xlim(0.2, 4.0)
ax1.set_ylim(0, None)

timesbig = ts.J(np.arange(1961, 2021, 0.001))

eposbig, mposbig = [x.at(timesbig).position.km for x in (earth, mars)]
r_earthbig = np.sqrt(((eposbig - mposbig)**2).sum(axis=0))
yearsbig = (timesbig.tt - t_1969) / 365.2564
ax3.plot(yearsbig, r_earthbig/1E+06)
closest = np.argmax(-r_earthbig)
ax3.plot(yearsbig[closest:closest+1], r_earthbig[closest:closest+1]/1E+06, 'or')

print(timesbig.utc_iso()[closest])

message_left = 'closest: ' + str(np.round(r_earthbig[closest:closest+1]/1E+06, 3)) + '  '
message_right = '  ' + timesbig.utc_iso()[closest]
ax3.text(yearsbig[closest], 10, message_left, ha='right')
ax3.text(yearsbig[closest], 10, message_right, ha='left')

ax3.set_xlabel('years since 1969-01-01')
ax3.set_xlim(yearsbig[0], yearsbig[-1])
ax3.set_ylim(0, None)

ax1.set_ylabel('E to M (Gm)')
ax2.set_ylabel('(Moon to M) - (E to M) (Gm)')
ax3.set_ylabel('E to M (Gm)')
plt.show()
