This isn't an actual answer, but you may find it of interest. ;)
As uhoh has mentioned, the central difficulty to an analytical solution of this problem is that there's no way to invert Kepler's equation using elementary functions. The equation is
$$M = E - e\sin E$$
where $M$ is the mean anomaly, $E$ is the eccentric anomaly, and $e$ is the eccentricity.
It's easy enough to solve it using a few rounds of Newton's method (unless $e$ is very close to 1), but that's not much use in an analytical approach, and your problem needs to solve it twice, once for each body. The traditional analytical approach is to approximate it using a few terms of a series; several options are given in the Wikipedia article.
The alternative is to just search for solutions numerically. If you know the time of the last closest approach you can make a reasonable initial estimate of the time of the next one by simply adding the relative synodic period of the two bodies.
Let $T_1 < T_2$ be the periods of the bodies. Then the synodic period is
$$T_s = \frac{T_1T_2}{T_2 - T_1}$$
If both the orbits are circular, this gives the exact solution. For eccentric orbits, it gives you the mean time between closest approaches.
Note that the relative velocity of the two bodies is zero at the closest (and furthest) approach, so the relative distance doesn't change much around that time.
I assume that you want a general solution for this problem. OTOH, if you want to solve it for actual Solar System bodies, you can get JPL Horizons to do the orbit calculations. It can easily give you the distance (and its rate of change) between any pair of objects in its system, and it knows a lot of objects: 1130203 asteroids, 3757 comets, 209 planetary satellites, 8 planets, the Sun, L1, L2, select spacecraft, and system barycenters.
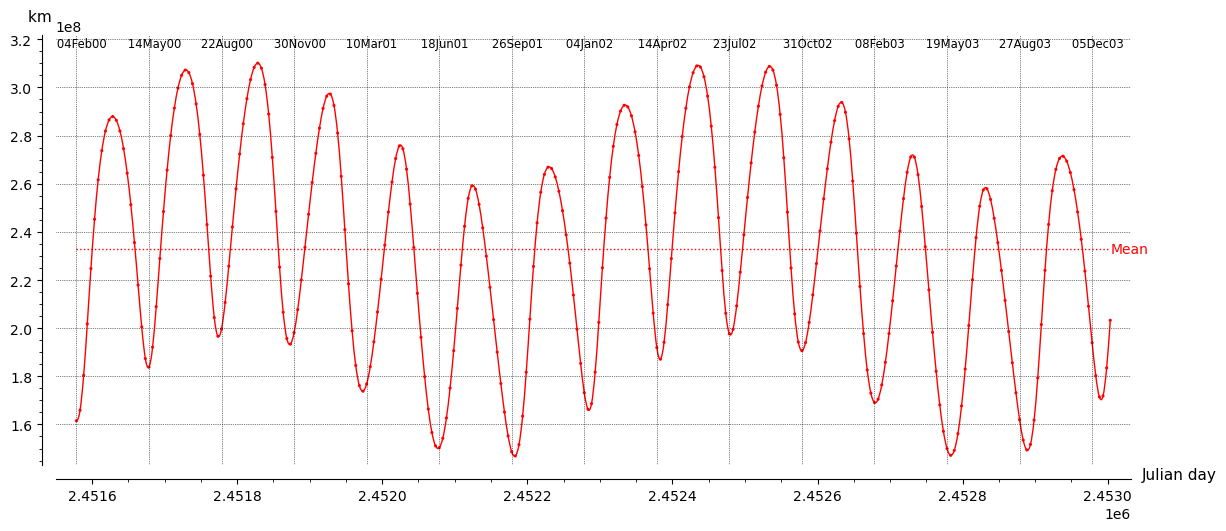
Here's a graph of the distance between Mars and Mercury over the period 2000-Feb-04 to 2003-Dec-30. I chose them because they are the planets with the most eccentric orbits. Mercury's eccentricity is 0.20563, Mars's is 0.0934. Their periods are 87.9691 days and 686.98 days, respectively, so their relative synodic period is ~100.888 days, which is ~1.1469 Mercury periods and ~0.1469 Mars periods. They had a close approach within a day of the starting time of the graph. The interval between the vertical date lines is 100 days.

As you can see, the period between successive close approaches is quite close to 100 days, although there is a bit of drift.
Here's a link to a live version of the Sage / Python program I used to create that graph. It can plot in SVG and PNG formats. You can use it on any objects that Horizons knows. It can be used to search "manually" for solutions to your problem, and perhaps it will be useful for validating other solution methods.
Please see the Horizons documentation for full details on specifying body IDs, times, and time steps. Briefly, a number from 1 to 9 identifies a planet barycenter (including Pluto), eg, 1 is Mercury, 4 is Mars. Append 99 to specify the body center. You need to prefix the observation center with @, otherwise the number is treated as the ID of an observatory. If you type a string into the target or center fields, Horizons will respond with a list of IDs that match that string.
Horizons accepts numerous date and time formats. To input a Julian day number, prefix it with jd.
The datestep parameter of my program sets the spacing of the vertical gridlines in the graph. A datestep of 10 means those lines are drawn for every 10 data points.
To reduce the number of Horizons requests, the program caches the last 3 sets of data that it fetches. If you make "cosmetic" changes to the graph without altering the target, center, or time parameters, the old data is reused.
