I have obtained the Classical Orbital Elements for a satellite on a given epoch, and now I would like to plot them on a 2D map.
Epoch (UTC):    16 January 2021 02:36:14
Eccentricity:   0.0013696
inclination:    99.1927°
perigee height:     841 km
apogee height:  861 km
right ascension of ascending node:  32.9631°
argument of perigee:    196.2436°
revolutions per day:    14.12448643
mean anomaly at epoch:  163.8298°
orbit number at epoch:  61541
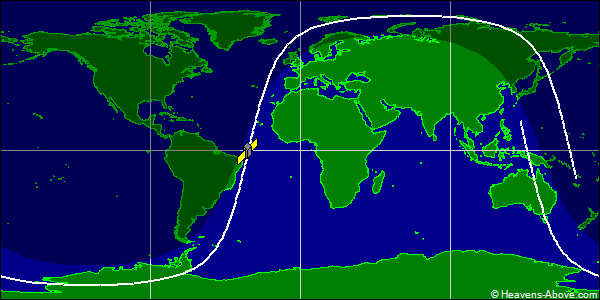
Which plots the following ground track:
Now, I would like to mathematically obtain the lat/long and be able to plot this. More specifically, what I would like to do, is pretty much the same thing that the approved comment here did: Analytical expression for the ground track of the International Space Station, but of course, with my COEs.
code taken from the answer above, with only value modification
import numpy as np
import matplotlib.pyplot as plt

twopi = 2*np.pi
to_degs, to_rads = 180/np.pi, np.pi/180.

omega = twopi/(102*60) # the period is about 102 minutes
omega_E = twopi/(23*3600 + 56*60 + 4)

time = 60 * np.arange(101.) # 100 minutes

t0 = 0. # arbitrary, you can fit this later
inc = 81.
const = 1  # arbitrary, you can fit this later

x = np.cos(omega * (time-t0))
y = np.sin(omega * (time-t0)) * np.cos(to_rads*inc)
z = np.sin(omega * (time-t0)) * np.sin(to_rads*inc)

lon = np.arctan2(y, x) - omega_E * (time-t0) + const
lat = np.arcsin(z)

if True:
    plt.figure()
    plt.plot(to_degs*lon, to_degs*lat, '.k')
    plt.xlim(-180, 180)
    plt.ylim(-90, 90)
    #plt.gca().set_aspect('equal')
    plt.show()
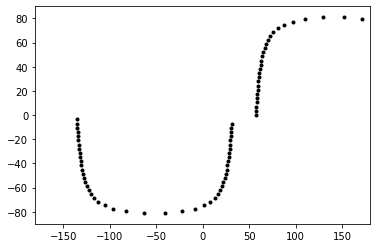
Which results in a:
Since we have an inclination of about 99 [deg], we can look at inclinations from 90 [deg] to 180 [deg] as -90 [deg] to 0 [deg]. So I assume that an inclination of ~81 [deg] should be correct in this plot.
My questions here are:
- How do I obtain the correct $t0$ (I was told that there answers on that on this site, but I am not sure how to look for it, so maybe a name/keyword for this would be enough for me to start looking for related questions/answers).
- How do I obtain the correct $const$ (same thing as the question above).
- Why does the plot stops at 0 [deg] lat, instead of continuing to reach the highest latitude, and then smoothly continue the line from the right to the left.

