11
$\begingroup$

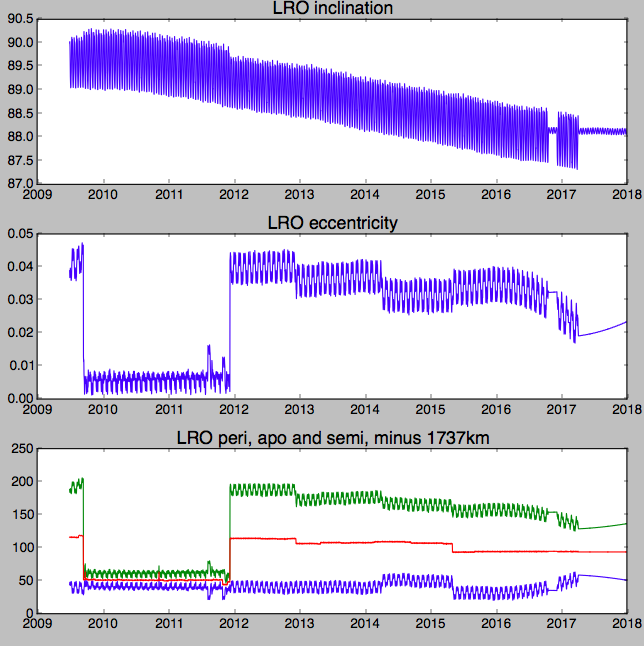
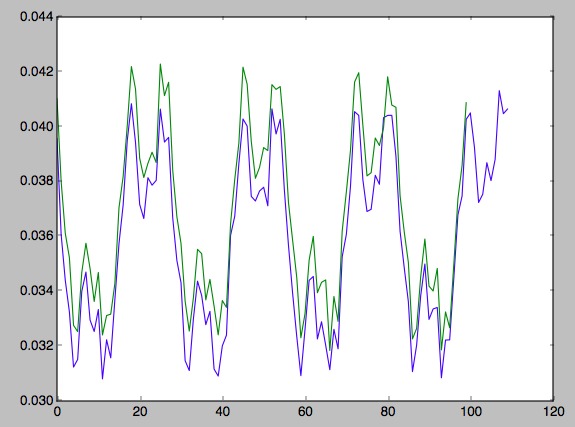
I plotted some of the orbital elements of the Lunar Reconnaissance Orbiter from JPL's Horizons database, and I see that there are constant oscillations. The period of the semi-major axis and eccentricity related parameters appears to be about 27.25 days (see last plot), which matches the orbital period of about 27.32 days. The oscillations in inclination however appear to oscillate with twice that frequency.

Why do the LRO's orbital elements appear to constantly oscillate?

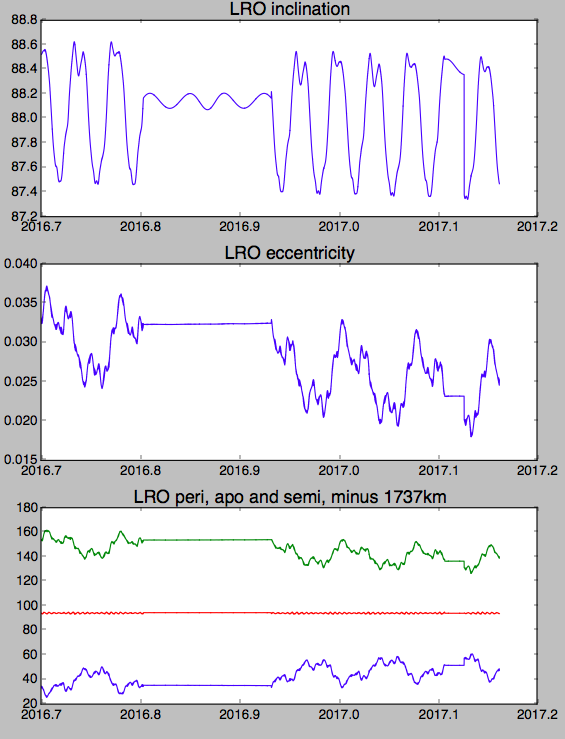
Also, are the sudden episodes of very constant eccentricity "real" or just artifacts of splicing/stitching/pasting different simulations together? Even when the eccentricity appears constant, oscillations are seen in the inclination and to a lesser degree the semi-major axis.

edit: I've just added the some history information about the various trajectories that have been concatenated. The "period of calm eccentricity" is from 2016-Oct-21 to 2016-Dec-07 so while it starts in the middle of 558day_20160907_01.bsp_V0.2, it does end on the same infamous date that that segment also ends.

But remember, I'm asking as much about the wiggles themselves as I am their absence.

enter image description here

SPACECRAFT TRAJECTORY: 
  Updated irregularly (on Horizons) or by request. 
  Concatenated historical (reconstructed) trajectories are from PDS. 

  Trajectory name                 Start (TDB)         Stop (TDB)
  ---------------------------  -----------------  -----------------
  Reconstructed trajectory     2009 Jun 18 22:16  2016 Sep 15 00:01
  558day_20160907_01.bsp_V0.2  2016 Sep 15 00:01  2016 Dec 07 00:01 predict
  558day_20161207_01.bsp_V0.2  2016 Dec 07 00:01  2017 Jan 04 00:01 predict
  558day_20170104_01.bsp_V0.1  2017 Jan 04 00:01  2018 Jul 16 00:01 predict
  558day_20170216_01.bsp_V0.1  2017 Feb 16 00:01  2018 Aug 28 00:01 predict

enter image description here

enter image description here

Below: Eccentricity plotted versus time (days) for two intervals shifted by 327 days showing a difference of 12 oscillations. The extracted period is 27.25, close to the orbital period of the moon of about 27.32 days.

enter image description here

$\endgroup$
13
  • $\begingroup$ Looks like active stabilization using RCS was activated. $\endgroup$
    – SF.
    Commented Mar 10, 2017 at 11:33
  • 4
    $\begingroup$ My money is on a telemetry interruption, which would make the cleanish sine wave in the inclination data an artifact of the Kalman filter. $\endgroup$ Commented Mar 10, 2017 at 16:53
  • 2
    $\begingroup$ @uhoh Yeah, and the future data looks just like the data that's being asked about, which is a large part of how I reached my conclusion. $\endgroup$ Commented Mar 10, 2017 at 17:59
  • 1
    $\begingroup$ @uhoh I'm reading about HORIZONS. It's not simply a numerical simulation. The data generated from actual (presumably filtered) measurements, with numerical simulation used to fill in gaps in the data. This is of course much more accurate than numerical simulation, as it allows for the correction of accumulated error and non-gravitational orbital perturbations. ssd.jpl.nasa.gov/pub/ssd/Horizons_doc.pdf I would also encourage you to learn more about Kalman filtering, as numerical integration can easily be built in. $\endgroup$ Commented Mar 14, 2017 at 14:03
  • 1
    $\begingroup$ @Schlusstein Discussion with you is very helpful - we were doing the same thing at the same time! While you were writing your comment I had updated the question with the same information. I looked at the output file Horizons saved to my disk - in each line, right after the JD and calendar date the first floating point number is eccentricity, and it abruptly starts hovering at about 3.23 or 3.24E-02 for the duration of the flat spot dates (JD 2457682.5 to 2457729.5). $\endgroup$
    – uhoh
    Commented Mar 14, 2017 at 15:06

2 Answers 2

7
+50
$\begingroup$

JPL HORIZONS features orbits interpolated from actual data rather than pure simulations. I suspect that what happened here is that there is no orbital data for the three sections of data that don't exhibit the oscillation. We know for a fact that there is no raw data for one of those sections because it is in the future. I spoke to a controls expert and he said my suspicion is probably correct.

When you use the webtool it says there are several data series with all but the first having the word predict at the end of the line. The dates at the end of those data series correspond to the returned oscillation of the data. I suspect that a new data series is begun when contact with the spacecraft resumes.

I believe the oscillation period of ~14 days corresponds to half of the moon's orbital period. Gravitational perturbation by the Earth would then be the main driver of this behavior. The fact that these oscillations occur quite visibly in the absence of real data indicates that the model is doing a decent job of accounting for this perturbation. As for why the amplitude drops considerably, I can't say for sure since I don't know enough about the model used, but I can guess that it's related to the unaccounted for nonuniform density of the moon and non-gravitational perturbations related to its orientation relative to the sun, such as light pressure and outgassing.

If you look at the eccentricity data you will see an oscillation with a period of ~14 days on top of an oscillation with a period of ~27 days, with some higher harmonics scattered. There is also a strong ~27 day period oscillation in the periapsis and apoapsis data. It might be interesting to apply a fourier transform to all of this. You could look at the relative magnitudes of perturbation by period and perhaps try to isolate some behavior with a period of one year.

$\endgroup$
2
  • $\begingroup$ Interpolated is not exactly the right word, fitted might be better. Uusually, the only high-precision data we get from spacecraft orbiting other bodies is delay-doppler. A specially coded/modulated signal is transmitted from the Deep Space Network (DSN) to the spacecraft, which rebroadcasts it back to Earth at another frequency, but carefully phase locked to the incoming carrier. The doppler shift and the absolute delay give relative speed and distance with respect to the ground station, but these are not true state vectors wrt the body orbited yet. $\endgroup$
    – uhoh
    Commented Mar 21, 2017 at 7:41
  • $\begingroup$ Simulations are used to generate simulated delay-doppler-type results and they are iteratively adjusted until they can reproduce measured delay-doppler data. Sometimes spacecraft data (cameras, accelerometers) might also be incorporated, but usually these don't offer enough precision to match the delay-doppler data. The three ground stations of DSN are busy day and night keeping eyes on spacecraft. Here is some cool delay-doppler data from a spacecraft around the moon, but in this case it is passive radar. $\endgroup$
    – uhoh
    Commented Mar 21, 2017 at 7:45
1
$\begingroup$

Based on some very helpful replies from Jon Giorgini at JPL and a bit of additional reading, I can summarize as follows:

The actual calculation of spacecraft orbits, combining both the effects of gravity and other forces in the Solar System plus orbital maneuvers of the spacecraft itself are combined/reconciled with available radar and telemetry. The result is of course the state vector table.

The osculating elements are derived from the state vectors for convenience only. They are not intended as primary sources of orbit data, and each set of points is only intended to be used to define the position of the spacecraft at that point in time.

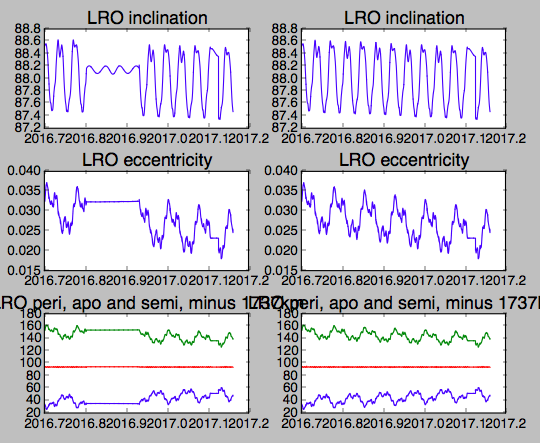
For a short period of time while waiting for either more data, or a decision about an upcoming maneuver, an alternate algorithm for the osculating elements seems to have been applied to a short span of dates, resulting in a smoother appearance of some of the plots.

This does not mean they are necessarily less accurate in position, because the elements are only ever intended to be used to define the position near the moment for which they are calculated. The spacectraft's true orbit is not really a conic section at all to begin with, especially considering the complicated gravity field of the Earth-Moon system.

Following the updated calculation, the appearance is back to expected, though this still equally valid.

As for the periodic variations themselves: The monthly and bi-monthly periodicities are manifestations of the reality of orbiting the lumpy gravitational field of the moon under the gravitational effects of the Earth. Since the Moon's orbit is significantly elliptical rather than circular, that strongly perturbing effect is periodic. These effects are made particularly visible in these plots because they are not simple Keplerian orbits to begin with, and trying to express them as such will highlight the difference.

Below is a quick comparison of the derived osculating elements before and after the regularly scheduled update. All is well.

enter image description here

$\endgroup$

Your Answer

By clicking “Post Your Answer”, you agree to our terms of service and acknowledge you have read our privacy policy.

Not the answer you're looking for? Browse other questions tagged or ask your own question.