5
$\begingroup$

I was under the impression that the mean elements are given by taking the average over an orbital period of the satellite, i.e.:

$e_{mean}(t) = \int_{t}^{t+T(t)}e_{osc}(t')dt'[0.367in]$

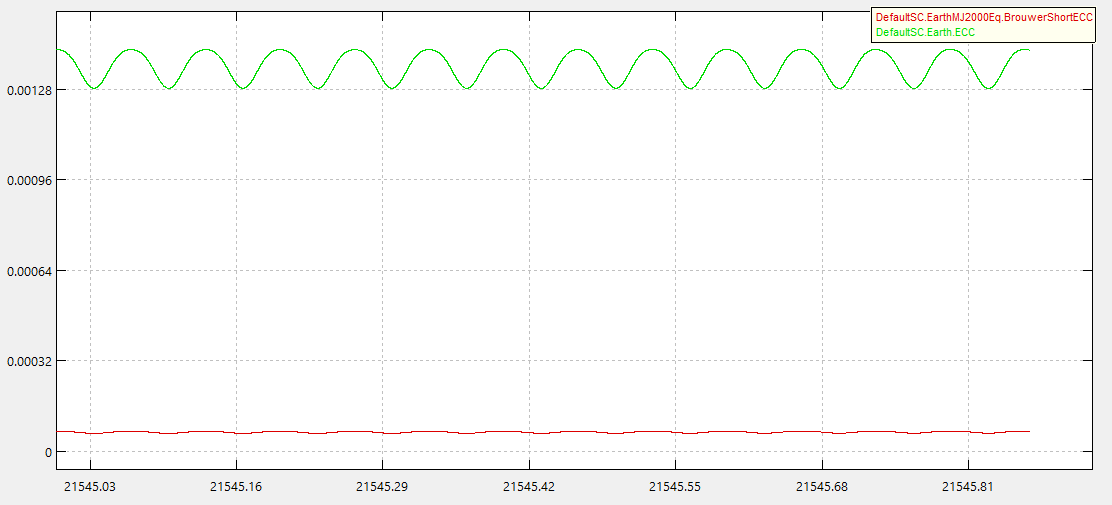
where $T(t)$ is the osculating orbital period given by $\sqrt{\frac{\mu}{a(t)^3}}$. (Might be wrong here, please correct me, I'm new to the topic). Regardless of the method of averaging, I couldn't explain to myself the results when I prescribe an orbit with eccentricity very close to zero in GMAT:

enter image description here

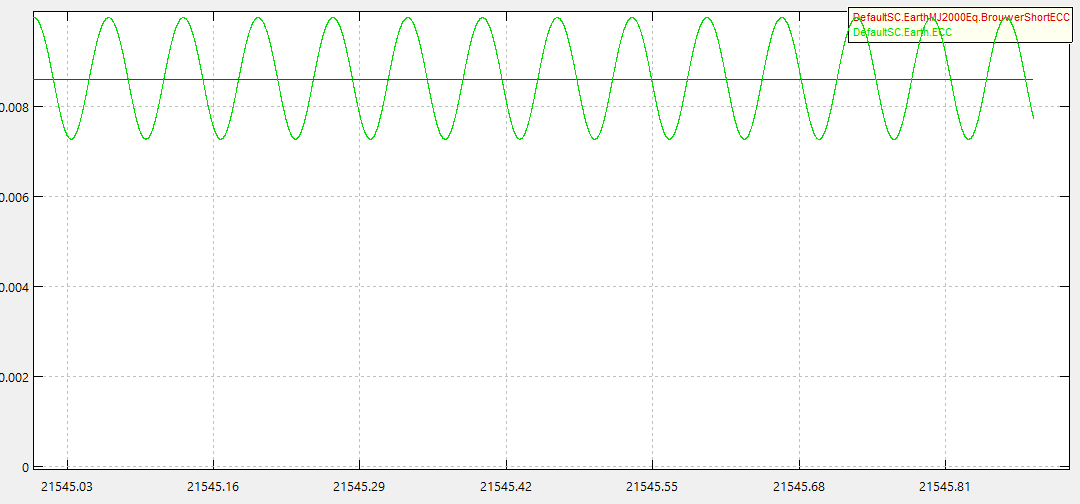
For larger eccentricities (0.01), the mean eccentricity does indeed behave like some sort of average:

enter image description here

What seems to be the problem here? Why is the mean eccentricity not behaving like an average in the case of eccentricities close to 0.001?

$\endgroup$

2 Answers 2

5
$\begingroup$

I was under the impression that the mean elements are given by taking the average over an orbital period of the satellite.

That is the wrong impression. To inject some somewhat crude humor, "It depends on what the meaning of the word 'means' means."

The Brouwer-Lyddane short transformation is a transformation between osculating elements and Brouwer-Lyddane short mean elements such that variations in the mean elements due to a non-spherical body are minimized over the short term, e.g., a few days. Over longer spans of time, the Korai mechanism might kick in, resulting in changes in the Brouwer-Lyddane short mean eccentricity. I'll ignore that as you're specifically asking about short mean elements.

For simplicity, suppose a vehicle is orbiting a body that has a non-zero J2 term and all other higher order gravity terms are zero. The vehicle's state is initialized using Brouwer-Lyddane short mean elements with an extremely small (or even zero) mean eccentricity. Suppose the vehicle's Cartesian state is propagated using a high quality integrator, and the osculating and mean elements are calculated from the propagated state at regular intervals. Over a short span of time (e.g. a few days) those mean elements will barely budge (except of course for mean mean anomaly).

In particular, the mean eccentricity will remain extremely close to zero. The osculating eccentricity cannot average to zero because eccentricity is always non-negative. At extremely low mean eccentricities the mean eccentricity will inevitably be well removed from the osculating eccentricity. That is exactly what you're seeing in your first plot. As the mean eccentricity increases it does indeed begin to look like the more standard meaning of "mean" (i.e., average). That is what you're seeing in your second plot.

But that is not what "mean" means in the context of mean elements. What "mean" means in this context is that the mean elements are somewhat analogous to the corresponding osculating elements but are transformed in a manner that reduces the variations seen in the osculating elements to a minimum.
$\endgroup$
2
  • $\begingroup$ Thanks for the reply! Would you be able to intuitively explain how this mean is defined? Does it happen to be related to averaging the eccentricity vector rather than the absolute eccentricity itself, and then converting it back to absolute eccentricity and AOP? I got quite confused because introductory texts such as that at: farside.ph.utexas.edu/teaching/celestial/Celestial/node93.html introduce only 'averaged' elements $\endgroup$
    – Jan Lynn
    Commented Jun 8, 2022 at 2:38
  • $\begingroup$ Might I humbly request a link to my own use of that phrase in space.stackexchange.com/questions/37042/… ? :) $\endgroup$
    – Ryan C
    Commented Jun 8, 2022 at 3:37
2
$\begingroup$

Mean elements are more akin to the removal of very short-term (on the order of single-orbit period) variations. It cannot remove non-periodic effects such as drag or solar radiation. It only "smooths" out periodic effects such as non-spherical geopotential terms. You can think of it as a low pass filter with time-averaging, where each definition of "mean" addresses different time scales.

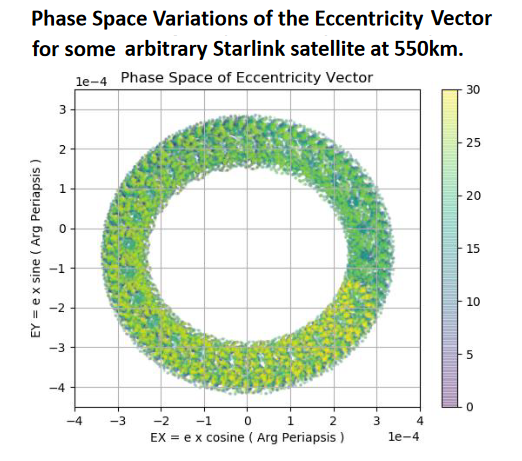
To explain your two diagrams, it is worth bringing up the concept of eccentricity phase space plots here. Below, I have the eccentricity phase space variation for a satellite at 600km altitude. The Euclidean distance of each scatter point from the origin is the magnitude of the osculating eccentricity taken for that sample. The colour bar simply represents the time at which the sample was taken (in days). Note that there are short term gyrations (small squiggles along the donut) and large variations (the one giant donut).

Eccentricity phase space plot of a random satellite

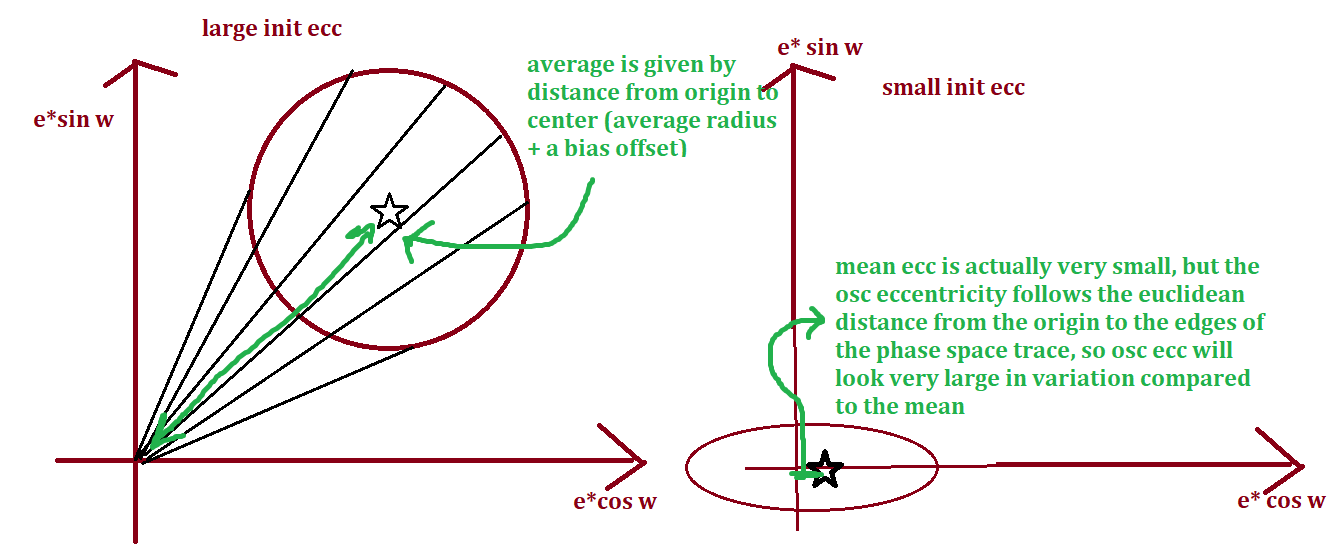
For larger eccentricities, the circle doesn't gyrate about the origin. Remember, on top of these variations, there is also a non-zero DC-bias offset for the eccentricity magnitude to begin with if you selected an eccentric orbit. That's why it won't necessarily be origin centered. You can think of "super-long-term" mean eccentricity as being somewhat close to distance from origin to the center of the phase circle.

For smaller initial osculating eccentricities, the distance from origin to the center of the phase circle could be very small, close to zero, even if the radius of the eccentricity vector gyrates with a larger non-zero value.

I have a crudely drawn diagram below explaining what I meant by these phase space variations of the eccentricity vector for large initial osculating eccentricities and small initial osculating eccentricities. This illustrates why you can get larger osculating eccentricities for a tiny mean eccentricity.

Crudely drawn diagram illustrating phase space variations of the eccentricity vector

$\endgroup$

Your Answer

By clicking “Post Your Answer”, you agree to our terms of service and acknowledge you have read our privacy policy.

Not the answer you're looking for? Browse other questions tagged or ask your own question.