Here is a rough description, it doesn't give you the exact answer but it does provide the bare minimum conceptual understanding that you need to make a start. TLDR: scroll down to "Key points" to get to the point quickly.
All non-inclination controlled geosynchronous objects, starting off at inclination = 0, exhibit an increase in inclination from 0deg to 15 deg and then back to 0 deg in a 56 year cycle. The cycle is much easier to visualise graphically.
Here is a quote from my other answer here: why-is-the-ribbon-of-decommissioned-geosynchronous-satellites-skewed
It is easier to visualise the combined behaviour of inclination and RAAN by imagining that the satellite's orbit is a spinning top with an axis at the middle which we'll call the orbit pole. In a controlled geostationary orbit the orbit pole is closely aligned with the Earth's spin axis. In a drifting orbit this pole traces out a circle whose own centre is ~7.5 degrees from the polar axis over a period of ~56 years. The inclination and RAAN can be thought of as the magnitude and direction of the orbit pole (OK, but for an inconvenient 90 degrees which I will gloss over, it's just a metaphor). Thus the maximum change in inclination is from 0 to about 15 degrees.
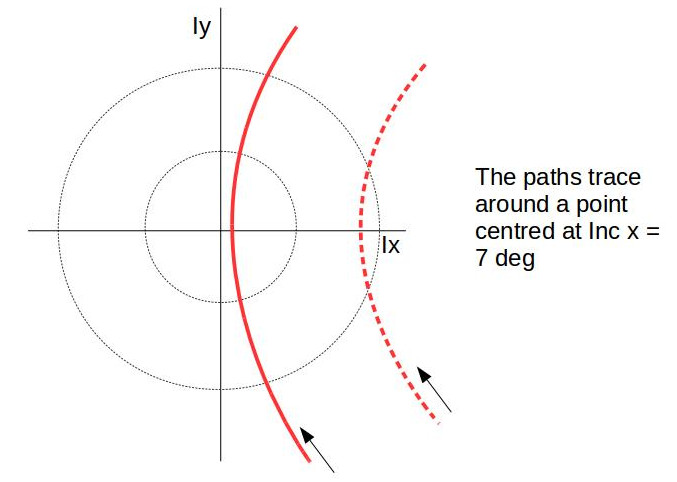
The diagrams in the article here found by asdfex in the answer whats-the-method-behind-this-tdrs-triplet-inclination-madness convey the same idea. As a rough sketch to save digesting the whole article see the diagram below. The axes are ix and iy, i.e. the polar view of the inclination vector.

The thick red trace shows the path of an object released with some finite RAAN and inclination. It traces down to inclination = 0 and then back up again. It will take many years to move across the arc shown and afterwards it will trace a circle and re-appear at the starting place decades later. The dashed red trace is another object released at a different RAAN/inc combination.
The rate of evolution, in terms of angles from the virtual centre of rotation at 7.5 degrees is the same for both red traces. As a result the magnitude of inclination, i.e. the distance from Ix=Ix=0.0, changes more slowly for the dashed red trace than for the solid line.
Key points:
there is no notion of "debouncing" to be had. The inclination vector magnitude is always positive.
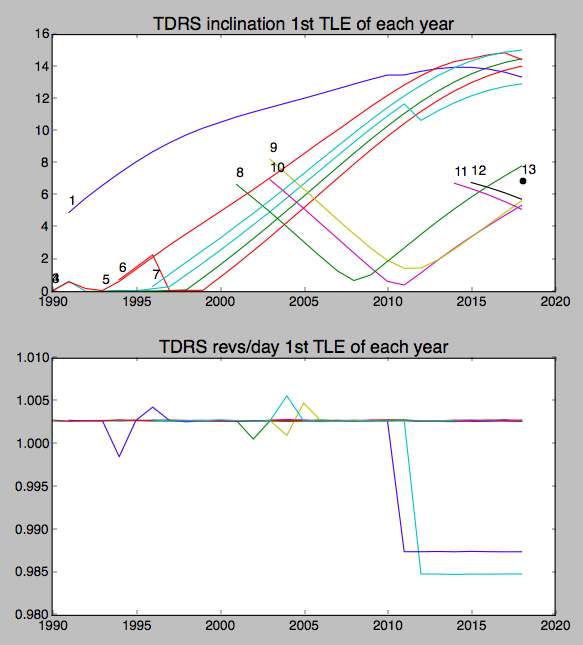
TDRS 1 actually looks as if it is already up at 15 degrees, its rate of change in terms of degrees per year, slows from 2010 onwards, which is what we'd expect for an object that had by then been in orbit for 27 years (launched 1983).
As TDRS1's earlier rate of progress is less than the other satellites even before 2010 it looks to me as if TDRS 1 was not originally launched into a 0 deg orbit. Its as if was released so that it is on a path like the dashed red trace, i.e. both its initial inclination and RAAN would have had to have been chosen to set this up.
Sometimes diagrams like this instead show Inc and RAAN as the axes rather than Iy and Ix. The process of choosing Inc and RAAN as initial mission parameters is analagous to choosing Ix and Iy.
As an aside an object that was previously station-kept in inclination will start off very close to Ix=Ix=0.0 and then follow the same arc too.

