2
$\begingroup$

So, I have got two reference TLE from 2 different Satellite in LEO-GEO, which are as follows: (1st TLE for LEO, 2nd TLE for GEO)

1 44072U 19015A   19265.80540496 -.00000053  00000-0  00000+0 0  9990
2 44072  97.8892 339.4753 0001195  83.2985 276.8367 14.83660044 27382

1 44476U 19049B   19263.72236756 +.00000078 +00000-0 +00000-0 0  9992
2 44476 000.0697 100.7846 0001501 038.3605 175.5638 01.00275593000497

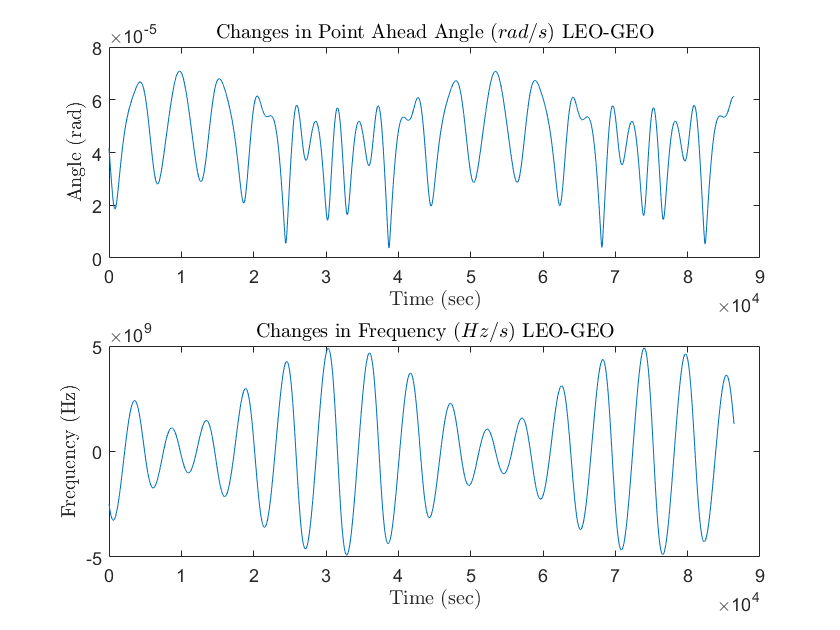
I have used SGP4 Orbit Propagator and Integrated (Analysis Period 20th September, 2019 10:00AM to 21st September, 2019 10:00AM)in Matlab and got Orbital State vector of both Satellite in Cartesian Co-ordinate. And also with the help of this answer I calculated Point-Ahead Angle and Doppler Shift. And I have got this :

enter image description here

But, I am not sure whether it's right or wrong because of variation in Angle?

UPDATE I have use ${\lambda}$ = $1550nm$ for Doppler Shift calculation. So that plot is ${\Delta f}$ vs $Time$. I am also adding my code in MATLAB; (where both .mat files are state vector rx ry rz vx vy vz)

clc
clear all
close all
format long g
t = 1:86401;
% LEO SATELLITE
load ('LEOPriPosVel.mat')
r1_x = LEOPriPosVel(:,1);   % Inertial Cartesian Coordinate Position X-axis of LEO Sat
r1_y = LEOPriPosVel(:,2);   % Inertial Cartesian Coordinate Position Y-axis of LEO Sat
r1_z = LEOPriPosVel(:,3);   % Inertial Cartesian Coordinate Position Z-axis of LEO Sat
v1_x = LEOPriPosVel(:,4);   % Inertial Cartesian Coordinate Velocity X-axis of LEO Sat
v1_y = LEOPriPosVel(:,5);   % Inertial Cartesian Coordinate Velocity Y-axis of LEO Sat
v1_z = LEOPriPosVel(:,6);   % Inertial Cartesian Coordinate Velocity Z-axis of LEO Sat
%GEO SATELLITE
load ('GEOIn39PosVel.mat')
r2_x = GEOIn39PosVel(:,1);   % Inertial Cartesian Coordinate Position X-axis of GEO Sat
r2_y = GEOIn39PosVel(:,2);   % Inertial Cartesian Coordinate Position Y-axis of GEO Sat
r2_z = GEOIn39PosVel(:,3);   % Inertial Cartesian Coordinate Position Z-axis of GEO Sat
v2_x = GEOIn39PosVel(:,4);   % Inertial Cartesian Coordinate Velocity X-axis of GEO Sat
v2_y = GEOIn39PosVel(:,5);   % Inertial Cartesian Coordinate Velocity Y-axis of GEO Sat
v2_z = GEOIn39PosVel(:,6);   % Inertial Cartesian Coordinate Velocity Z-axis of GEO Sat
for i = 1:86401
    r(i,1) = r1_x(i) - r2_x(i);
    r(i,2) = r1_y(i) - r2_y(i);
    r(i,3) = r1_z(i) - r2_z(i);
    v(i,1) = v1_x(i) - v2_x(i);
    v(i,2) = v1_y(i) - v2_y(i);
    v(i,3) = v1_z(i) - v2_z(i);
    modr12(i) = sqrt((r(i,1)*r(i,1)) + (r(i,2)*r(i,2)) + (r(i,3)*r(i,3)));
    modv12(i) = sqrt((v(i,1)*v(i,1)) + (v(i,2)*v(i,2)) + (v(i,3)*v(i,3)));
    unitvecR(i,1) = r(i,1)/modr12(i);
    unitvecR(i,2) = r(i,2)/modr12(i);
    unitvecR(i,3) = r(i,3)/modr12(i);
    crossVR (i,1) = v(i,2)*unitvecR(i,3) - v(i,3)*unitvecR(i,2);
    crossVR (i,2) = -(v(i,1)*unitvecR(i,3) - v(i,3)*unitvecR(i,1));
    crossVR (i,3) = v(i,1)*unitvecR(i,2) - v(i,2)*unitvecR(i,1);
    dotVR12 (i) = -(v(i,1)*unitvecR(i,1) + v(i,2)*unitvecR(i,2) + v(i,3)*unitvecR(i,3));
    modcrossVR12 (i) = sqrt((crossVR (i,1)*crossVR (i,1)) + (crossVR (i,2)*crossVR (i,2)) + (crossVR (i,3)*crossVR (i,3)));
end
modr = modr12';
modv = modv12';
modcrossVR = modcrossVR12';
dotVR = dotVR12';
for i = 1:86401
    c =  299792.458;
    lambda = 1.55e-9; 
    PAA12(i) = 2*modcrossVR(i)/c;
    CF12(i) = dotVR(i)/lambda;
end
denomin = denom';
PAA = PAA12';
CF = CF12';
figure (1)
subplot(2,1,1)
plot (t,PAA)
title('Changes in Point Ahead Angle $(rad/s)$ LEO-GEO','Interpreter','latex')
xlabel('Time (sec)','Interpreter','latex')
ylabel('Angle (rad)','Interpreter','latex')
subplot(2,1,2)
plot (t,CF)
title('Changes in Frequency $(Hz/s)$ LEO-GEO','Interpreter','latex')
xlabel('Time (sec)','Interpreter','latex')
ylabel('Frequency (Hz)','Interpreter','latex')
$\endgroup$

1 Answer 1

1
$\begingroup$

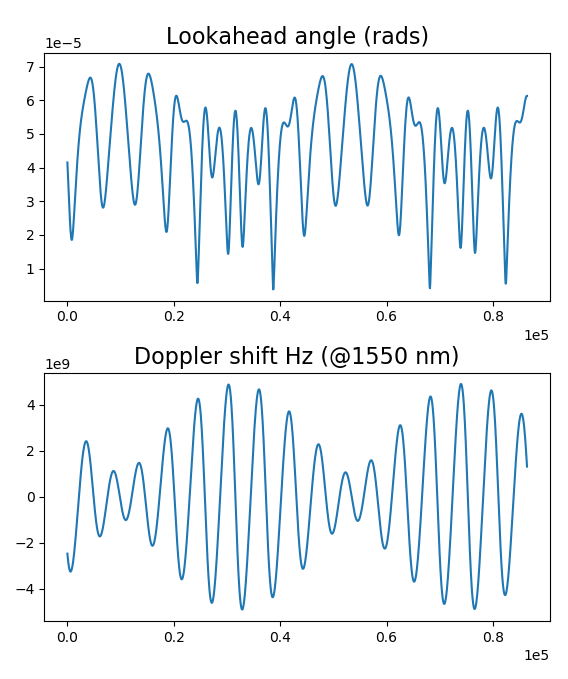
Partial answer. Here's what I have so far. I use Python instead of Matlab, and I "roll my own" dot products, but these plots do look a lot like your plots! I think there might be a missing "2" in the expression for angle, but now that you mentioned you're using 1550 nm light we seem to agree on the size of the Doppler shift though there is still a sign difference.

Have a look.

In the mean time I'll make a more careful numerical analysis of a few specific points.

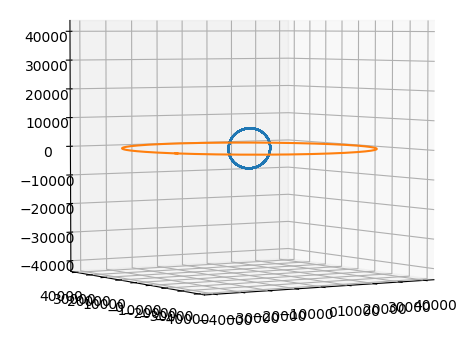
enter image description here

enter image description here

This is Python 3, using the Skyfield package.

TLEs = """1 44072U 19015A   19265.80540496 -.00000053  00000-0  00000+0 0  9990
2 44072  97.8892 339.4753 0001195  83.2985 276.8367 14.83660044 27382
1 44476U 19049B   19263.72236756 +.00000078 +00000-0 +00000-0 0  9992
2 44476 000.0697 100.7846 0001501 038.3605 175.5638 01.00275593000497"""

import numpy as np
import matplotlib.pyplot as plt
from skyfield.api import Topos, Loader, EarthSatellite
from mpl_toolkits.mplot3d import Axes3D

load  = Loader('~/Documents/fishing/SkyData')  # single instance for big files
ts    = load.timescale()
de421 = load('de421.bsp')
earth = de421['earth']

minutes = np.arange(24*60 + 1)
seconds = 60. * minutes
times   = ts.utc(2019, 9, 20, 10, minutes) # starts 09-Sep-2019 10:00 UTC

L0, L1, L2, L3 = TLEs.splitlines()

LEO = EarthSatellite(L0, L1)
GEO = EarthSatellite(L2, L3)

LEOposns = LEO.at(times).position.km   # kilometers
GEOposns = GEO.at(times).position.km

LEOvels  = LEO.at(times).velocity.km_per_s
GEOvels  = GEO.at(times).velocity.km_per_s

if True:
    for i, positions in enumerate((LEOposns, GEOposns)):
        plt.subplot(2, 1, i+1)
        for component in positions:
            plt.plot(seconds, component)
    plt.show()

r    = LEOposns - GEOposns
rhat = r / np.sqrt((r**2).sum(axis=0))

clight = 2.9979E+05  # km/sec
lam    = 1550E-12    # km (1550 nanometers expressed in kilometers)
f      = clight / lam

df_f = -((LEOvels - GEOvels) * rhat).sum(axis=0) / clight
df   = df_f * f
cross = np.cross( (LEOvels - GEOvels).T, rhat.T).T
angle = 2 * np.sqrt((cross**2).sum(axis=0)) / clight

if True:
    fig = plt.figure()
    ax  = fig.add_subplot(2, 1, 1)
    ax.ticklabel_format(style='sci',scilimits=(-3,4),axis='both')
    ax.plot(seconds, angle)
    ax.set_title('Lookahead angle (rads)', fontsize=16)
    ax  = fig.add_subplot(2, 1, 2)
    ax.ticklabel_format(style='sci',scilimits=(-3,4),axis='both')
    ax.plot(seconds, df)
    ax.set_title('Doppler shift Hz (@1550 nm)', fontsize=16)
    plt.show()

if True:
    fig = plt.figure()
    ax  = fig.add_subplot(1, 1, 1, projection='3d')
    x, y, z = LEOposns
    print(x.max())
    ax.plot(x, y, z)
    x, y, z = GEOposns
    print(x.max())
    ax.plot(x, y, z)
    ax.set_xlim(-42000, 42000)
    ax.set_ylim(-42000, 42000)
    ax.set_zlim(-42000, 42000)
    plt.show()
$\endgroup$
5
  • 1
    $\begingroup$ +1 perfect. Well, I have taken $\mathbf{\Delta f = Relative Radial Velocity/\lambda}$, where $\mathbf{\lambda = 1550 nm}$ $\endgroup$
    – JOY
    Commented Oct 2, 2019 at 11:25
  • $\begingroup$ can you also show me in the same code, how we can get Orbital State vector in python from those TLE? $\endgroup$
    – JOY
    Commented Oct 2, 2019 at 11:55
  • $\begingroup$ I have updated it, with codes, may be you can have a look. $\endgroup$
    – JOY
    Commented Oct 2, 2019 at 12:12
  • 1
    $\begingroup$ @JOY Okay I've made an update using 1550 nm and the agreement is improving nicely. What's nice about Python is that you can find packages that do just about anything you like. Here I use the package Skyfield and I'll add a note in the answer as well. Python is free and open source and really, really fun. This is as far as I can go today, I'll check back tomorrow. Thanks for the Matlab! $\endgroup$
    – uhoh
    Commented Oct 2, 2019 at 12:16
  • 1
    $\begingroup$ +1 @uhoh I used to use Python but then I switched to Matlab, so I lost my path in Python, but still I know something about Python but not hardcore. I will start to use Skyfield package in python3. Thanks for the info. $\endgroup$
    – JOY
    Commented Oct 2, 2019 at 12:31

Your Answer

By clicking “Post Your Answer”, you agree to our terms of service and acknowledge you have read our privacy policy.

Not the answer you're looking for? Browse other questions tagged or ask your own question.