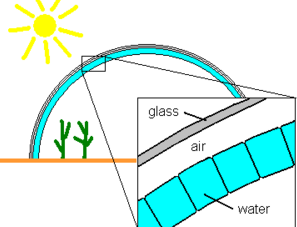
Would a greenhouse using a watershield 10 meters in depth be able to receive enough sunlight to grow crops?
-
$\begingroup$ Great question! In this answer I found a copy of your image at marspedia It's best to cite/credit the original source of images when using them. $\endgroup$– uhohCommented Apr 23, 2018 at 4:41
-
1$\begingroup$ Whoops, I forgot. Thank you for pointing it out! $\endgroup$– opaque_dragonCommented Apr 23, 2018 at 14:39
-
$\begingroup$ As a ballpark you can assume average sunlight intensity decreases at 3.5% per meter of water so after 10 meters you've got roughly 70% surface intensity. Mars light intensity per area is around half of Earth's so sunlight intensity would be around 35% of Earth's at max assuming noon and clear Martian weather. $\endgroup$– DragongeekCommented Apr 23, 2018 at 16:35
1 Answer
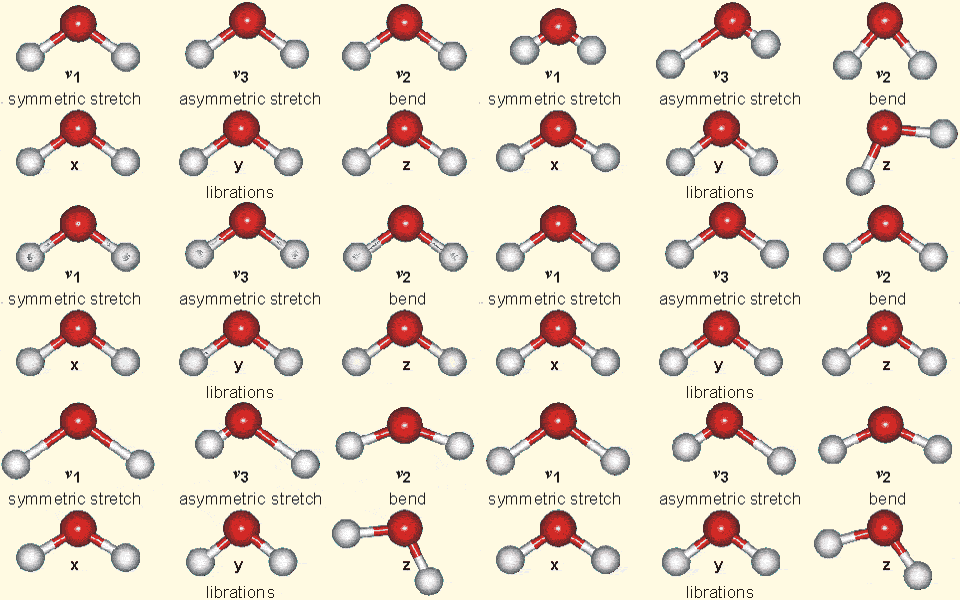
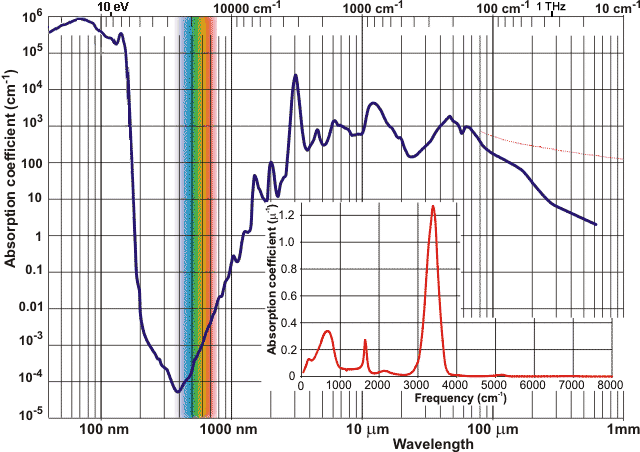
tl;dr: Water is a strongly polar molecule and interacts strongly with infrared light with through (mostly) vibrational modes. GIF from here:
The coupling is so strong that water is substantially absorbing of even red visible light, including where photosynthesis is important. In order to make this work, you'll need to pay attention to the particular spectral sensitivity of the species you are growing. As explained in this answer without a good balance of both red and blue light, plants will grow strangely.
Also, don't forget:
- There are also Fresnel reflections at each interface, mostly at the entrance and exits from air/atmosphere to glass, but a bit also at the glass/water interfaces.
- Life is tenacious and stuff tries to grow wherever there is an energy source and water. You'll need to make sure algae or other stuff does not start to grow in the water, increasing turbidity and reducing transmission due to absorption and scattering.
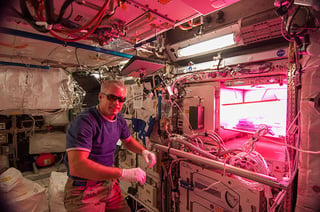
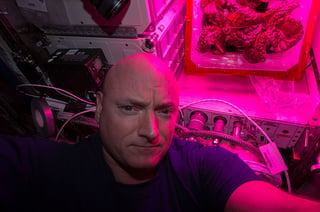
That plants need or at least really want both red and blue light is the reason for the otherworldly color seen in LED lighting for plants, for example as shown in the question Have there been at least continuous periods of plants growing on the ISS?.
Click for full size
above left: NASA astronaut Steve Swanson of Expedition 39 activated the red, blue and green LED lights of the Veggie plant growth system on May 7, 2014. above right: NASA astronaut Scott Kelly took this selfie with the second crop of red romaine lettuce in August of 2015. both: From here. Credits: NASA
The wavelength-dependent absorption coefficient of water can be found in Wikipedia and a compendium of sources can be found here, but whenever the topic of the properties of water comes up it's good to refer to Martin Chaplin's famous site on all things water, and for wavelength-dependent absorption, go straight to his Water Absorption Spectrum page.
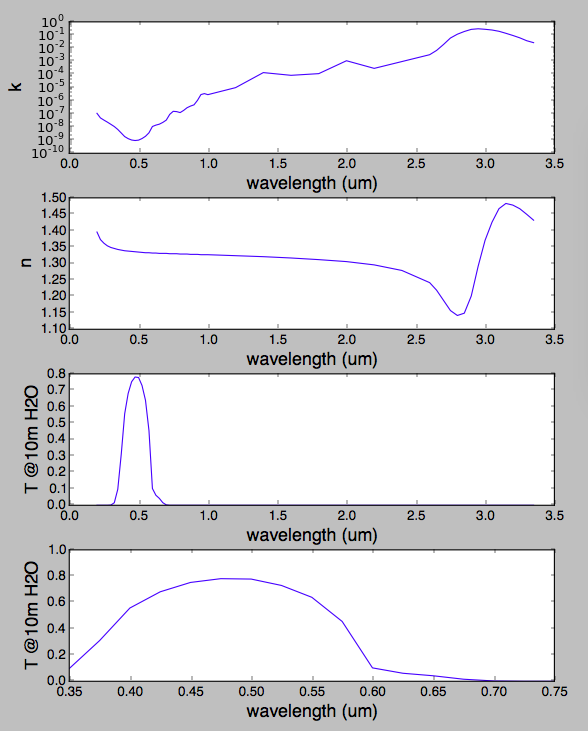
You can read more about changing between attenuation coefficient and transmission in this answer, I'll just say here that the electric field after propagating a distance x in water is just
$$\frac{E}{E_0} \ = \ exp\left(j \left(n + jk\right) \frac{2\pi}{\lambda} x \right) $$
and you have to square that to get intensity.
In the script below I've taken n and k values from Optical Constants of Water in the 200-nm to 200-μm Wavelength Region (George M. Hale and Marvin R. Querry March 1973 Applied Optics Vol. 12, No. 3, 555) and converted to transmission through 10 meters. As you can see in the plot, 10 meters of even pure water will strongly absorb at the extreme red and blue ends of the visible spectrum.
And this is a problem because the Chlorophyl of plants really needs those extremes! Here are some plots from the question Are two colors (red + blue) necessary for LED grow lights, or would either color be sufficient?
From here:
Both Chl-a and Chl-b primarily absorb red and blue light, the most effective colors in photosynthesis. They reflect or transmit green light, which is why leaves appear green. The ratio of Chl-a to Chl-b in the chloroplast is 3:1.
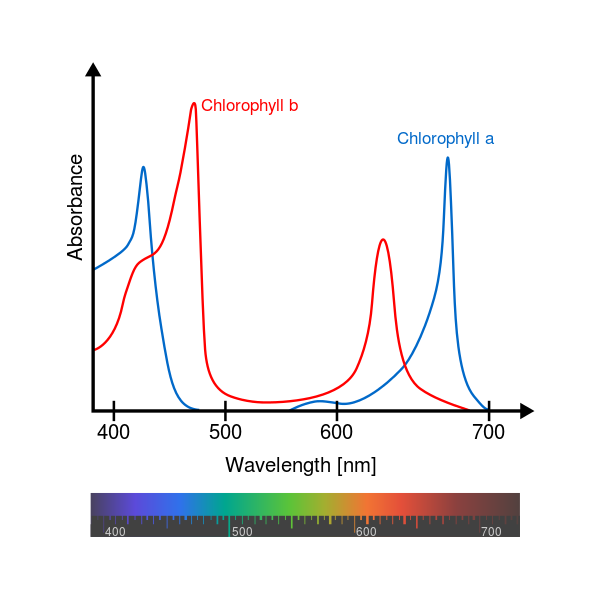
above: From this answer, also seen here.
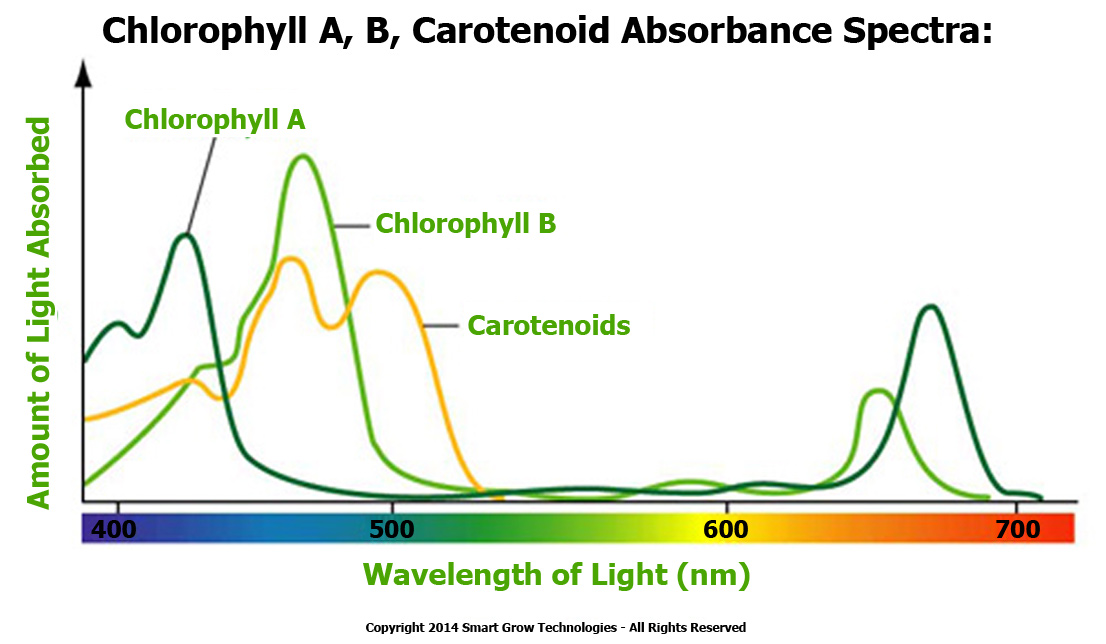
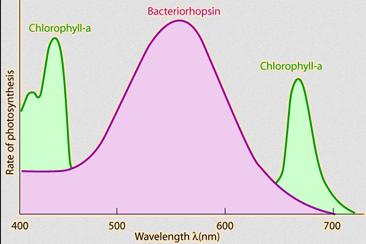
above: x2 From this answer.
# https://www.osapublishing.org/ao/abstract.cfm?URI=ao-12-3-555
# Optical Constants of Water in the 200-nm to 200-Mm Wavelength Region
# George M. Hale and Marvin R. Querry March 1973 / Vol. 12, No. 3 / APPLIED OPTICS 555

lam_um = [0.2, 0.225, 0.25, 0.275, 0.3, 0.325, 0.35, 0.375, 0.4, 0.425, 0.45,
          0.475, 0.5, 0.525, 0.55, 0.575, 0.6, 0.625, 0.65, 0.675, 0.7, 0.725,
          0.75, 0.775, 0.8, 0.825, 0.85, 0.875, 0.9, 0.925, 0.95, 0.975, 1.0,
          1.2, 1.4, 1.6, 1.8, 2.0, 2.2, 2.4, 2.6, 2.65, 2.7, 2.75, 2.8, 2.85,
          2.9, 2.95, 3.0, 3.05, 3.1, 3.15, 3.2, 3.25, 3.3, 3.35]

k      = [1.1e-07, 4.9e-08, 3.35e-08, 2.35e-08, 1.6e-08, 1.08e-08, 6.5e-09,
          3.5e-09, 1.86e-09, 1.3e-09, 1.02e-09, 9.35e-10, 1e-09, 1.32e-09,
          1.96e-09, 3.6e-09, 1.09e-08, 1.39e-08, 1.64e-08, 2.23e-08, 3.35e-08,
          9.15e-08, 1.56e-07, 1.48e-07, 1.25e-07, 1.82e-07, 2.93e-07, 3.91e-07,
          4.86e-07, 1.06e-06, 2.93e-06, 3.48e-06, 2.89e-06, 9.89e-06, 0.000138,
          8.55e-05, 0.000115, 0.0011, 0.000289, 0.000956, 0.00317, 0.0067, 0.019,
          0.059, 0.115, 0.185, 0.268, 0.298, 0.272, 0.24, 0.192, 0.135, 0.0924,
          0.061, 0.0368, 0.0261]

n      = [1.396, 1.373, 1.362, 1.354, 1.349, 1.346, 1.343, 1.341, 1.339, 1.338,
          1.337, 1.336, 1.335, 1.334, 1.333, 1.333, 1.332, 1.332, 1.331, 1.331,
          1.331, 1.33, 1.33, 1.33, 1.329, 1.329, 1.329, 1.328, 1.328, 1.328,
          1.327, 1.327, 1.327, 1.324, 1.321, 1.317, 1.312, 1.306, 1.296, 1.279,
          1.242, 1.219, 1.188, 1.157, 1.142, 1.149, 1.201, 1.292, 1.371, 1.426,
          1.467, 1.483, 1.478, 1.467, 1.45, 1.432]

import numpy as np
import matplotlib.pyplot as plt

lam_um, k, n = [np.array(thing) for thing in (lam_um, k, n)]
lam          = 1E-06 * lam_um

twopi        = 2.*np.pi
j            = np.complex(0, 1)

x            = 10. # meters

T = np.abs(np.exp(j*(n + j*k)*(twopi/lam)*x))**2

if True:
    plt.figure()
    plt.subplot(4, 1, 1)
    plt.plot(lam_um, k)
    plt.yscale('log')
    plt.ylabel('k', fontsize=16)
    plt.xlabel('wavelength (um)', fontsize=16)
    plt.subplot(4, 1, 2)
    plt.plot(lam_um, n)
    plt.ylabel('n', fontsize=16)
    plt.xlabel('wavelength (um)', fontsize=16)
    plt.subplot(4, 1, 3)
    plt.plot(lam_um, T)
    plt.ylabel('T @10m H2O)', fontsize=16)
    plt.xlabel('wavelength (um)', fontsize=16)
    plt.subplot(4, 1, 4)
    plt.plot(lam_um, T)
    plt.ylabel('T @10m H2O)', fontsize=16)
    plt.xlabel('wavelength (um)', fontsize=16)
    plt.xlim(0.35, 0.75)
    plt.ylim(0.0, 1.0)
    plt.show()
