An estimate is fine. But if possible, I am looking for a reference that I can cite.
1 Answer
This is the beginnings of a partial answer, I'm happy if someone takes over or adds to it.
Why not do all six missions instead of just one?
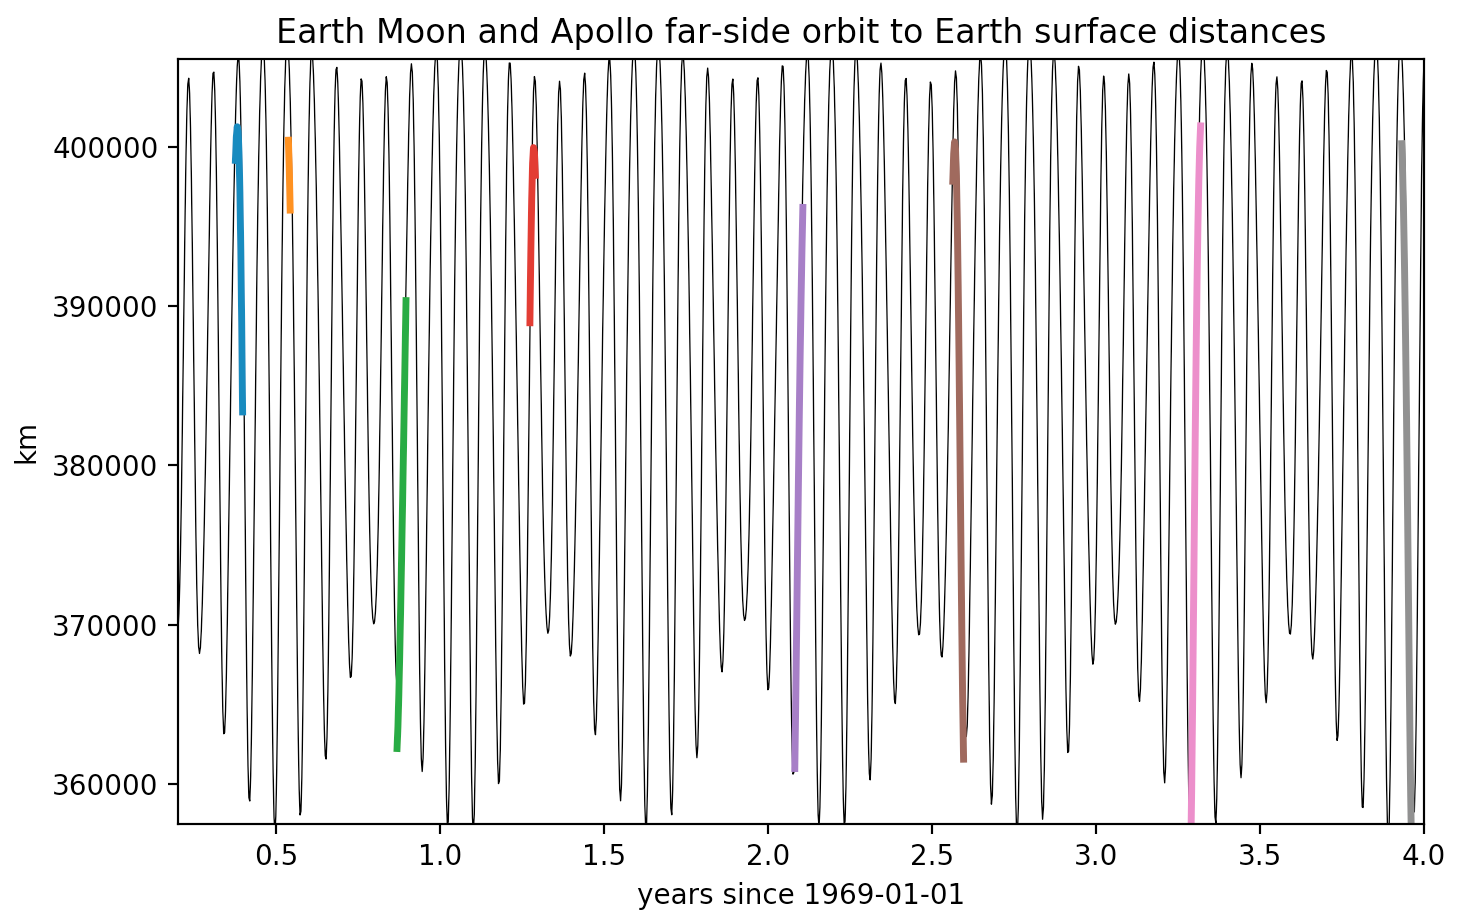
Using scripts from these 1, 2 I've plotted the distance between the Earth and Moon centers as the think black line, then the thick color bars are those distances minus the Earth radius, plus the Moon's radius plus a far-side altitude of 183 km.
The lengths of the bars are the aproximate total mission lengths and so we'll have to add in the times of each ingress and egress of passing behind the Moon.
I'm not sure where to find these but if someone can point me in the right direction I can scrape the numbers and add them here.
from skyfield.api import Topos
from skyfield.api import Loader
import numpy as np
import matplotlib.pyplot as plt

from skyfield.api import load
loaddata = Loader('~/Documents/fishing/SkyData')  # avoids multiple copies of large files

ts = loaddata.timescale() # include builtin=True if you want to use older files (you may miss some leap-seconds)
eph = loaddata('de421.bsp')

earth, moon, venus = [eph[x] for x in ('earth', 'moon', 'venus')]

apollos = [(10, 1969, 5, 18, 26), (11, 1969, 7, 16, 18),
           (12, 1969, 11, 14, 24), (13, 1970, 4, 11, 17),
           (14, 1971, 1, 31, 40), (15, 1971, 7, 26, 38),
           (16, 1972, 4, 16, 27), (17, 1972, 12, 7, 19)]
# https://en.wikipedia.org/wiki/Apollo_program

timez_apollo = []
for n, year, month, d_start, d_stop in apollos:
    times = ts.utc(year, month, range(d_start, d_stop+1))
    timez_apollo.append(times)

days = 1 + np.arange(5*365.2564+1)
times = ts.utc(1969, 1, days)
years = days/365.2564
t_1969 = times.tt[0]

earthpos, moonpos = [x.at(times).position.km for x in (earth, moon)]
r = np.sqrt(((moonpos - earthpos)**2).sum(axis=0))

Rmoon, Rearth = 1737., 6378.
alt = 183.

fig = plt.figure()
ax1 = fig.add_subplot(1, 1, 1)
ax1.plot(years, r, '-k', linewidth=0.5)

for timez in timez_apollo:

    yearz = (timez.tt - t_1969) / 365.2564

    earthpoz, moonpoz = [x.at(timez).position.km for x in (earth, moon)]
    r = np.sqrt(((moonpoz - earthpoz)**2).sum(axis=0))
    d = r + Rmoon + alt - Rearth

    ax1.plot(yearz, d, linewidth=2.5)
ax1.set_xlim(0.2, 4.0)
ax1.set_ylim(357500, 405500)
ax1.set_ylabel('km')
ax1.set_title('Earth Moon and Apollo far-side orbit to Earth surface distances')
ax1.set_xlabel('years since 1969-01-01')
plt.show()
-
$\begingroup$ "Why not do all six missions instead of just one?" Because that was not what was asked for. $\endgroup$– JoeCommented Nov 27, 2020 at 17:42
-
$\begingroup$ @Joe this is an unfinished work in progress. I had this much laying around already and didn't see a need to truncate quite yet. I'll be looking for the higher granularity dates and hopefully so will others. If it turns out they're only available for Apollo 11 then it will narrow down to that quickly. But if it turns out the source has dates for all missions then why not solve for all of them at the same time. It will answer your question but have extra information as well. It's pretty common for an answer to contain more information than the minimum. $\endgroup$– uhohCommented Nov 27, 2020 at 22:50
-
$\begingroup$ Let's see how things unfold over the next few days. If you are under a time constraint and need an approximate answer soon, then let me know and I'll try to do my best for Apollo 11 as soon as you do, it's just that there are some great space historians here who might be able to do it better. $\endgroup$– uhohCommented Nov 27, 2020 at 22:50
-
$\begingroup$ I'm unable to reproduce your Apollo 11 plot. According to JPL HORIZONS, Earth centre to Moon centre distance was 394,506km at 1969-Jul-19 17:22 UTC (Apollor 11 lunar orbital injection). Subtracting Earth radius and adding lunar radius + orbital altitude, the result should be well below 400,000km, yet your plot is above that. $\endgroup$ Commented Dec 8, 2020 at 17:07
-
1$\begingroup$ Interesting bit of info: lunar delta-range was almost -50m/s at insertion (and growing), so the furthest point from Earth must have happened on the very first orbit, shortly after insertion. That's before the circularisation burn. $\endgroup$ Commented Dec 9, 2020 at 0:58
