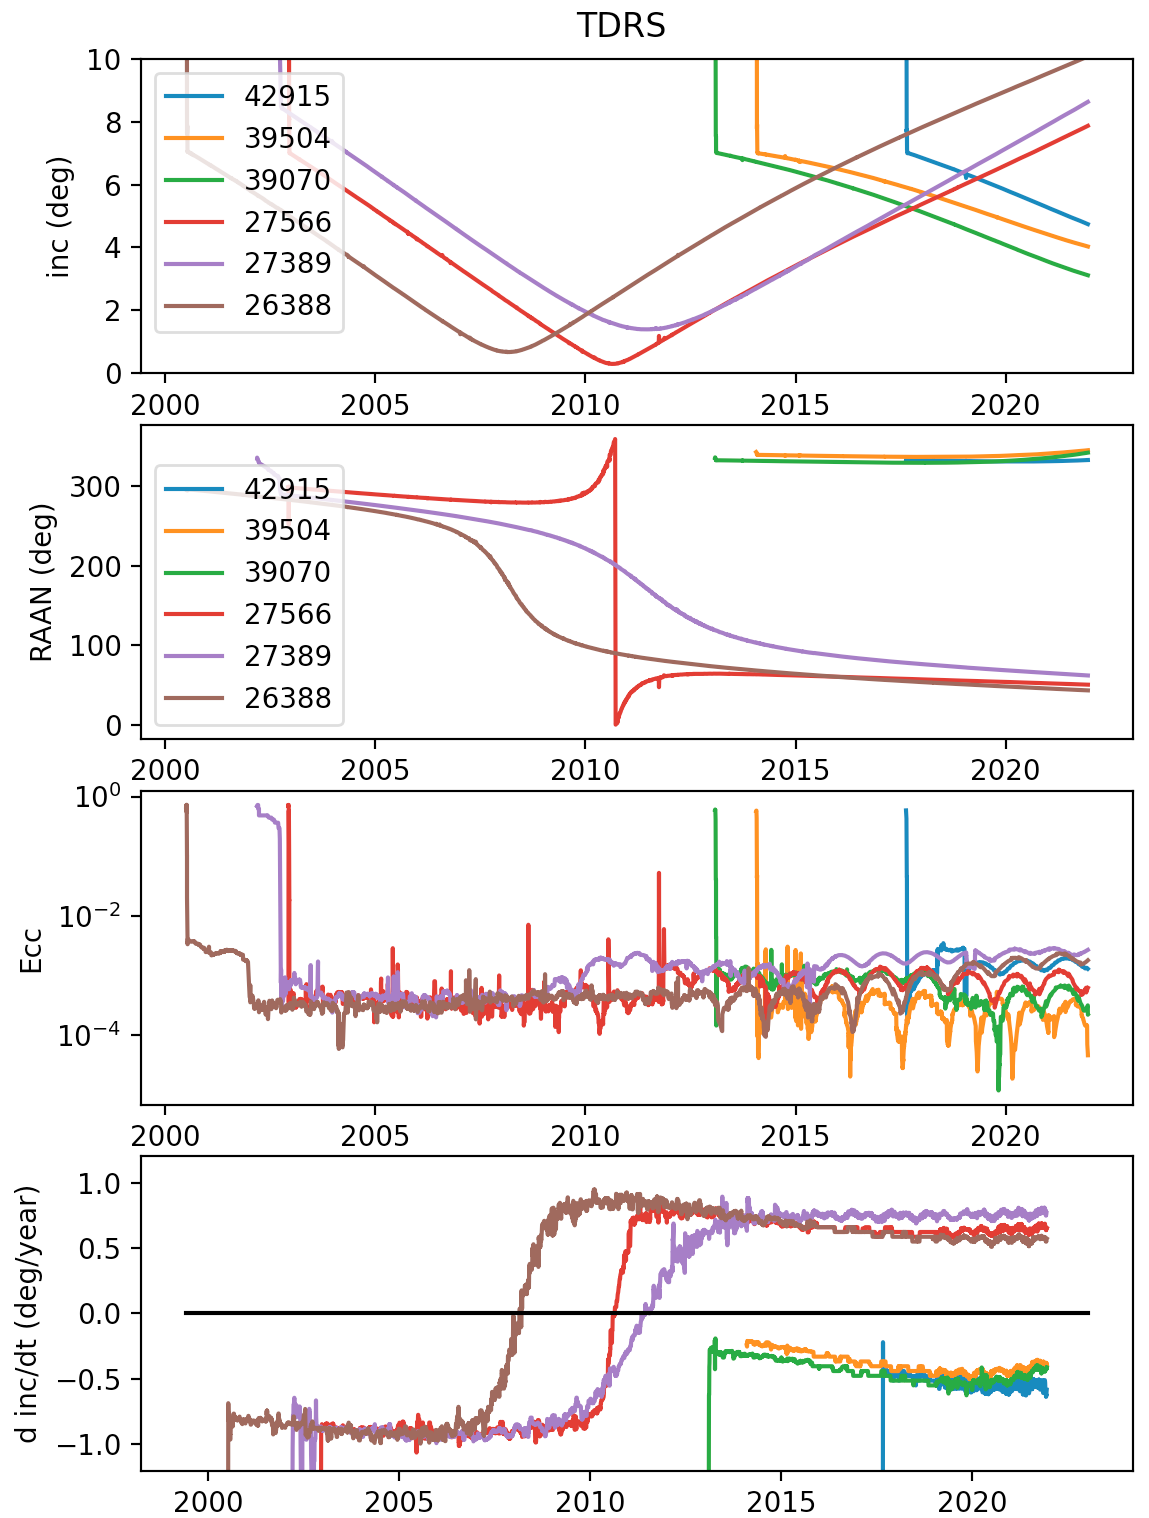
The most recent six TDRS satellites (8 through 13) were inserted into moderate inclination orbits of roughly 7°, and in all cases their inclinations immediately decreased at rates of about +/-1 or +/-0.5 degrees per year.
I'm curious both about the underlying orbital mechanics and the mission design going on here.
Questions:
- Why was the decision made to put TDRS 8 through 13 at about 7° in inclination?
- Why do they always drift downward towards zero inclination, and the ones that get there seem to be "repelled" by zero and instead of crossing zero slow down, stop at a small but finite positive inclination then start back up again. $\text{d} i / \text{d} t$ seems parabolic near the minimum but linear otherwise!
- Why does the inclination of the most recent three TDRS satellites change by half the rate for the first three? (~0.5 deg/year vs. 1 deg/year for the first three)
Related and potentially helpful answers:
- Why do the geosynchronous TDRS satellites have this distribution of inclinations? (discussion below @Eviatar.E's answer inspired this question)
- Why does TDRS 1's inclination evolve so much differently than that of all the others starting in 1995? (@Puffin's excellent answer is also the beginnings of an answer here!)
- What's the method behind this TDRS triplet inclination "madness"?
- How can I "debounce" these TDRS satellite inclinations? (reconstruct the zero-crossings) (no answer, perhaps should be quickly answered and/or closed?
The six TDRS satellites (8 through 13) are 26388, 27389, 27566, 39070, 39504, 42915
Data is from the following query in Space-Track.org:
https://www.space-track.org/basicspacedata/query/class/gp_history/NORAD_CAT_ID/26388,27389,27566,39070,39504,42915/orderby/TLE_LINE1 DESC/EPOCH/2000-01-01--2022-01-01/format/tle
script for plotting:
import numpy as np
import matplotlib.pyplot as plt
from datetime import datetime, timedelta

fname = 'TDRS TLEs for inclination.txt'

with open(fname, 'r') as infile:
    TLEs = np.array(infile.readlines()).reshape(-1, 2)

print('TLEs.shape: ', TLEs.shape)

satdict_unsorted = dict()

for L1, L2 in TLEs:
    satid = int(L1[2:7])
    year = 2000 + int(L1[18:20])
    decimal_days = float(L1[20:32])
    # https://stackoverflow.com/a/34910712/3904031
    datetim = datetime(year, 1, 1) + timedelta(decimal_days - 1)
    seconds_since_epoch = (datetim - datetime(1970, 1, 1)).total_seconds()
    decimal_year = 1970. + seconds_since_epoch / (365.2564 * 24 * 3600)
    inc = float(L2[8:16])
    raan = float(L2[17:25])
    ecc = float('.' + L2[26:33])
    n = float(L2[52:63])
    T = 24 * 3600 / n
    info = [year, decimal_days, seconds_since_epoch, decimal_year,
            inc, raan, ecc, T, n]
    try:
        satdict_unsorted[satid].append(info)
    except:
        satdict_unsorted[satid] = [info]

satdict = dict()
for key, thing in satdict_unsorted.items():
    thing.sort(key=lambda x: x[2])
    print('len(thing): ', len(thing))
    print('len(thing[1]): ', len(thing[1]))
    satdict[key] = np.array(list(zip(*thing)))

if True:
    fig, (ax1, ax2, ax3, ax4) = plt.subplots(4, 1)
    names = 'inc (deg)', 'RAAN (deg)', 'Ecc', 'T (sec)'
    T_siderial = 23 * 3600 + 56 * 60 + 4.09
    for key, thing in satdict.items():
        years, inc, raan, ecc, T, n = thing[3:9]
        ax1.plot(years, inc, label=str(key))
        ax1.set_ylabel('inc (deg)')
        ax2.plot(years, raan, label=str(key))
        ax2.set_ylabel('RAAN (deg)')
        ax3.plot(years, ecc, label=str(key))
        ax3.set_ylabel('Ecc')
        # implement a crude rolling median removing TLEs too close together
        d_t = years[1:] - years[:-1]
        d_inc = inc[1:] - inc[:-1]
        keep = d_t > 100. / 3600 / 365.2564 # years
        dinc_dt = d_inc[keep] / d_t[keep]
        yearz = years[:-1][keep] # fudge
        N = 20
        rolling = [np.median(dinc_dt[i:i+N]) for i in range(len(dinc_dt)-N)]
        ax4.plot(yearz[10:-10], rolling)
        ax4.set_ylabel('d inc/dt (deg/year)')
    ax1.legend()
    ax2.legend()
    ax1.set_ylim(0, 10)
    ax3.set_yscale('log')
    ax4.set_ylim(-1.2, 1.2)
    ax4.plot(ax4.get_xlim(), [0, 0], '-k')
    fig.suptitle('TDRS')
    plt.show()
