0
$\begingroup$

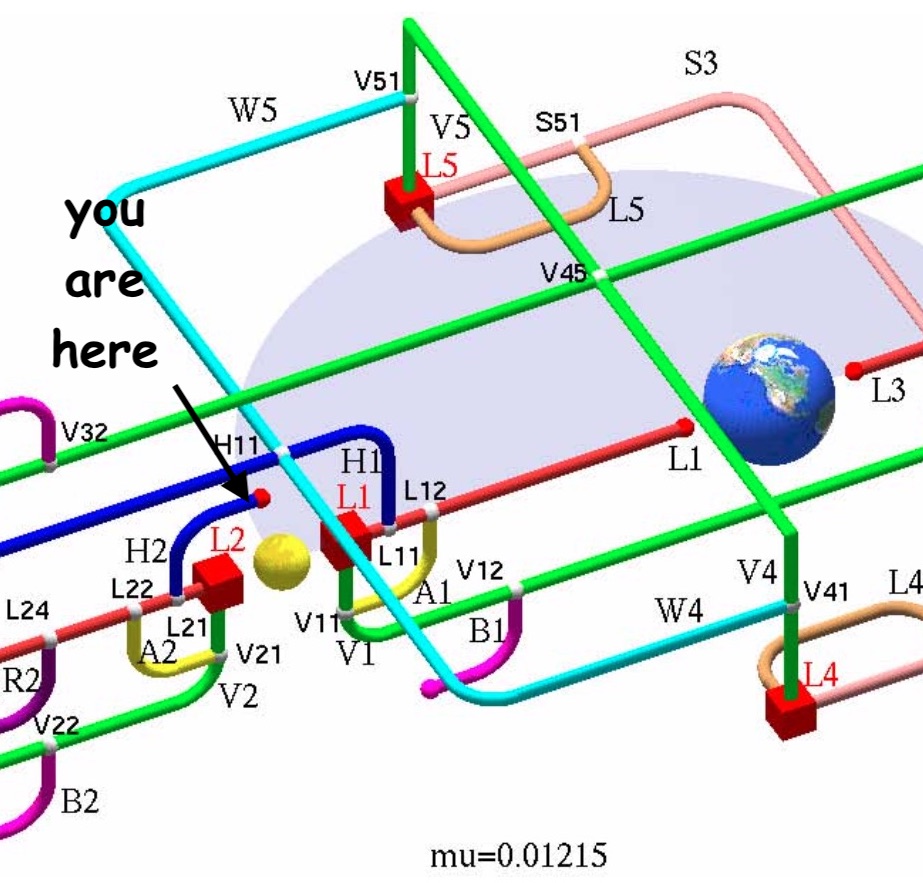
Below is a $\mu = 0.01215$ bifurcation plot from E. J. Doedel, E.J. et al's Elemental periodic orbits associated with the libration points in the circular restricted 3-body problem International Journal of Bifurcation and Chaos, Vol. 17, No. 08, pp. 2625-2677 (2007) (paywalled, but also readable in ResearchGate)

Question: How will the planned Artemis Mission to the Moon move around in this Earth-Moon 3 body bifurcation plot? Where's the near-rectilinear halo orbit for example?

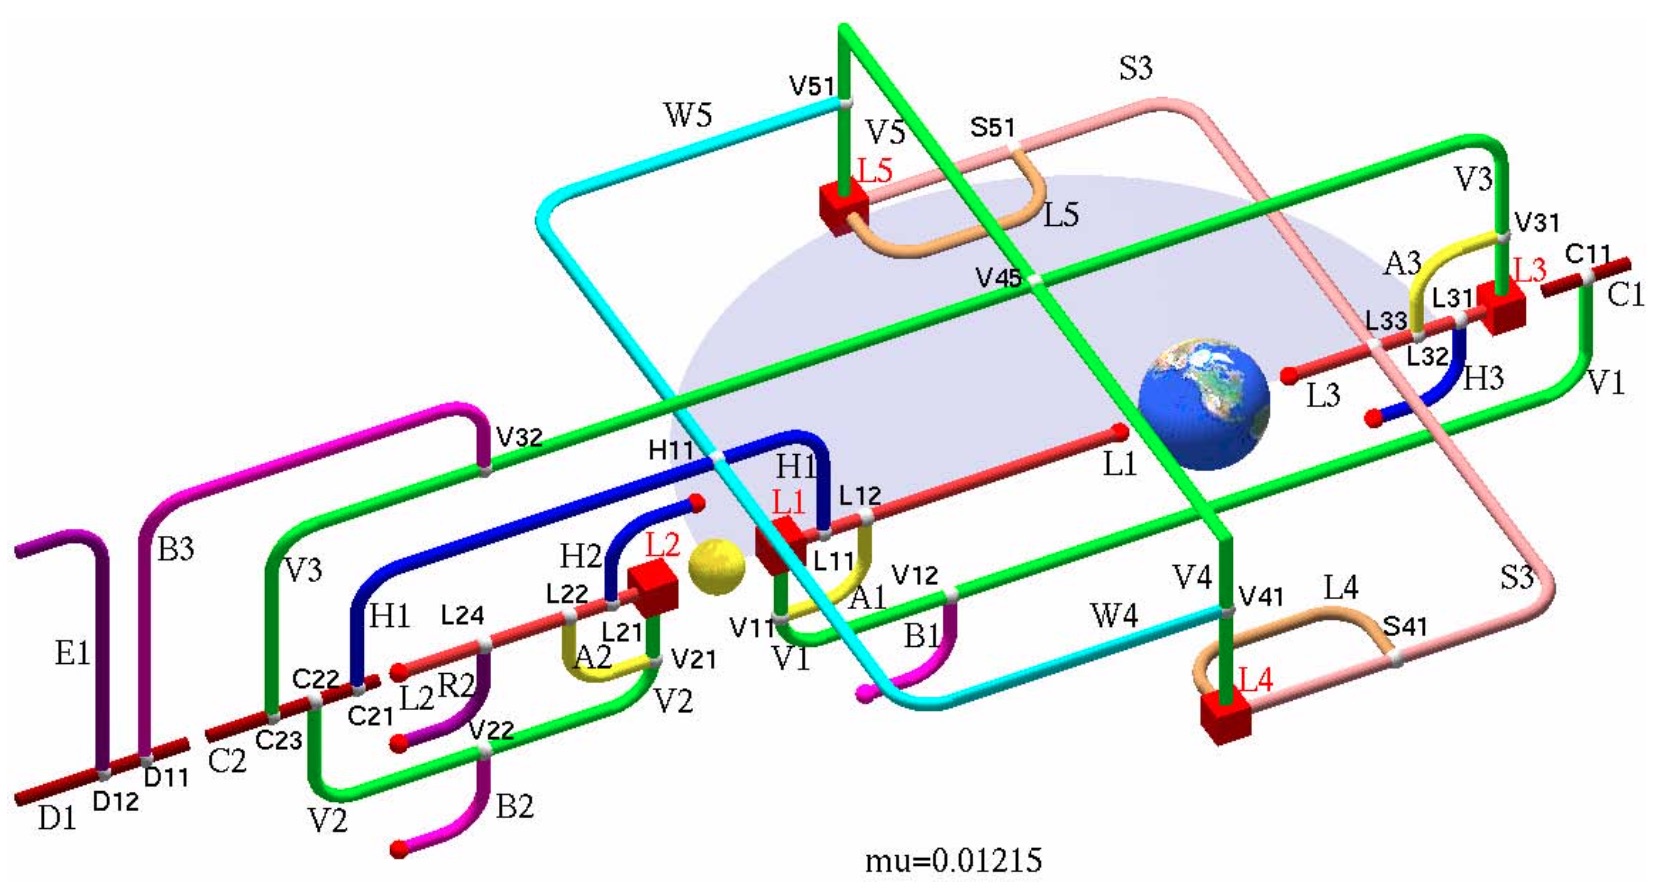
Doedel et al (2007) Fig. 3. Bifurcation diagram for the Earth–Moon system (μ = 0.01215), showing families of periodic orbits that emanate from the libration points and from subsequent branch points

Fig. 3. Bifurcation diagram for the Earth–Moon system (μ = 0.01215), showing families of periodic orbits that emanate from the libration points and from subsequent branch points. The red cubes are the libration points. Small white spheres denote branch points, and small dark-red spheres denote collision orbits. The planar families C1, C2, and D1, are only partially represented; in particular, the fact that D1 arises from C1 via a period-doubling bifurcation is not indicated in the diagram. A glossary of the notation used is given in Table 1.

$\endgroup$
3
  • $\begingroup$ Looks like NRHO are part of the V family, V1 and V2 in the Artemis case. The question "Where" seems to be quite misleading for this kind of plot. $\endgroup$
    – asdfex
    Commented Feb 13, 2022 at 14:30
  • $\begingroup$ @asdfex If I understand correctly (and I'm not sure I do) then V1 and V2 are the long green worms hanging down from the red cubes (L1, L2) and moving far away to C11 and C22. I don't see anything misleading; wouldn't those NRHO's be close to the L1/L2 ends of the green lines? Take a look at the dashed lines that I've drawn in this answer. The position along the bifurcation line has a real meaning (ordinal, but not exactly quantitative) and I think it's spelled out in the paper. $\endgroup$
    – uhoh
    Commented Feb 13, 2022 at 14:47
  • $\begingroup$ In the V2 diagram, an A2 orbit and therefore the V21 node is shown, and this seems quite close to the proposed Artemis orbit. I don't like how this diagram here mixes spatial order (planets, L-points) with the non-spatial relation between different orbits. E.g. V21 is by no means "below" L2. $\endgroup$
    – asdfex
    Commented Feb 13, 2022 at 15:43

1 Answer 1

1
$\begingroup$

Can't sleep so...

(Cropped and annotated from) Fig. 3. Bifurcation diagram for the Earth–Moon system (μ = 0.01215), showing families of periodic orbits that emanate from the libration points and from subsequent branch points.

(Cropped and annotated from) Fig. 3. Bifurcation diagram for the Earth–Moon system (μ = 0.01215), showing families of periodic orbits that emanate from the libration points and from subsequent branch points. The red cubes are the libration points. Small white spheres denote branch points, and small dark-red spheres denote collision orbits. The planar families C1, C2, and D1, are only partially represented; in particular, the fact that D1 arises from C1 via a period-doubling bifurcation is not indicated in the diagram. A glossary of the notation used is given in Table 1.

I've added an arrow pointing to the H2 branch near the end furthest from Earth-Moon L2 near the 'small dark-red sphere' which denotes the 'collision orbit' with the Moon.

In this paper the $H_{i=1, 2, 3}$ designates the "conventional" halo orbits we all know and love, associated with the three collinear Lagrange points L1, L2 and L3. In this paper's schemes for naming all these crazy orbits $H_i$ seems to be for "halo" and $L_i$ for either "Lyapunov" ($i=1, 2, 3$) or "Long" ($i=4, 5$).

In other papers these same halo orbits are often labeled as $L_i, i=1, 2, 3$ See for example:

Basically our friendly neighborhood halo orbits that we think of as giant slightly flattened but mostly round and titled are from the chunk of orbits near the middle of the mathematical family, and as you look to the extreme end closest to the Moon they get more and more thin and vertical, with perilunes that will eventually intersect the lunar surface (that small dark red sphere) if you take it to the extreme.
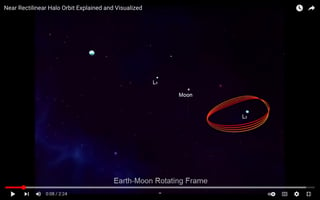
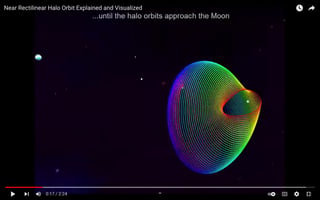
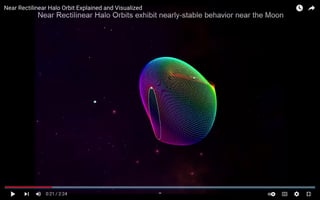
screenshot from "Near Rectilinear Halo Orbit Explained and Visualized" https://youtu.be/X5O77OV9_ek screenshot from "Near Rectilinear Halo Orbit Explained and Visualized" https://youtu.be/X5O77OV9_ek screenshot from "Near Rectilinear Halo Orbit Explained and Visualized" https://youtu.be/X5O77OV9_ek

above: Screenshot from Near Rectilinear Halo Orbit Explained and Visualized click for larger below: "Fig. 14. The Northern Halo family H2 of the Earth–Moon system."
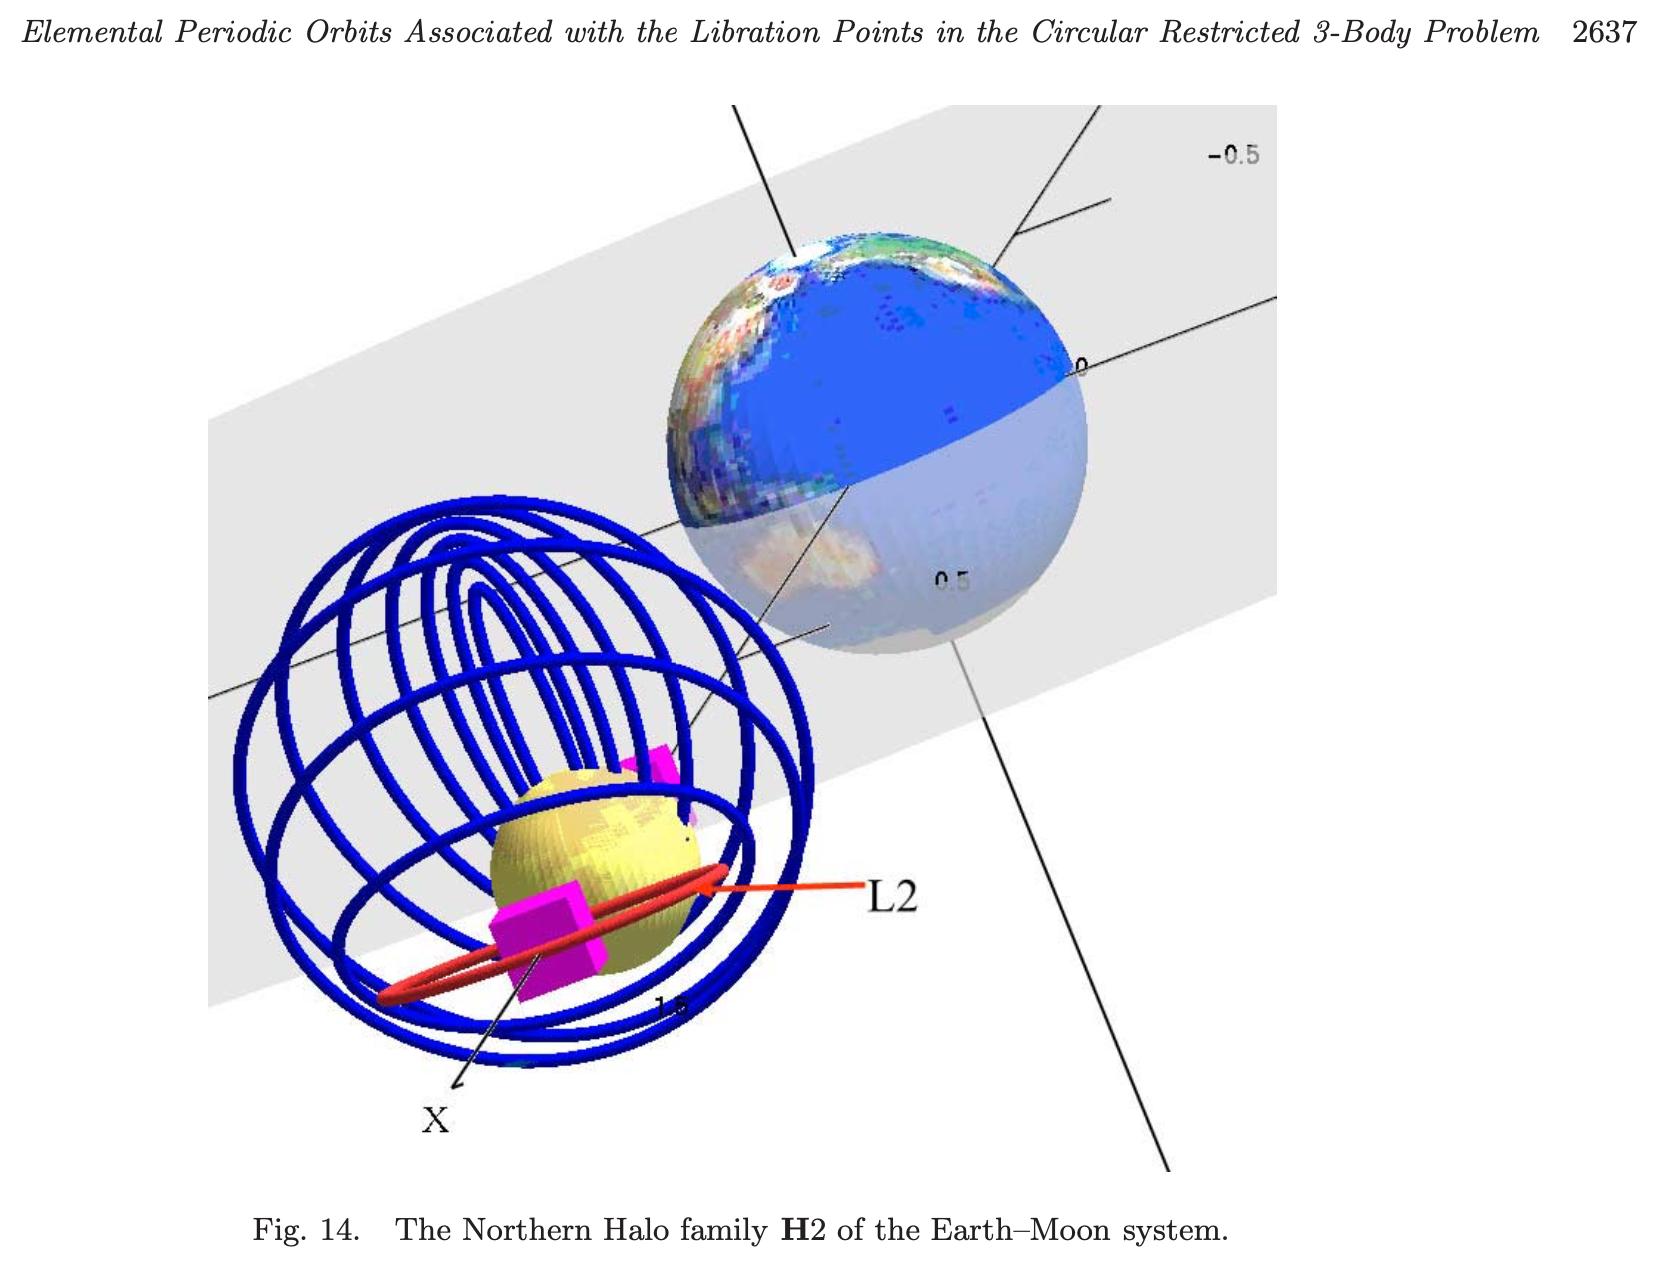
Fig. 14. The Northern Halo family H2 of the Earth–Moon system.

This figure is suboptimal and confusing, but it shows the same family of curves shown in the video. The red curve is the "beginning" of the family as a nearly flat orbit around L2, and the last blue vertical line that intersects the absurdly oversized rendering of the Moon is the L2 near rectilinear halo orbit of Artemis fame.

The label "L2" points to the horizontal beginning of the $L_2$ family of halo orbits, denoted in red.

The unlabeled close pink cube is the Earth-Moon L2 point, the other one partially obscured by the absurdly oversized Moon is the L1 point. The most vertical blue halo orbit is not behind the Moon near L1, it shoots straight down through the top of this oversized Moon to orbit its center.
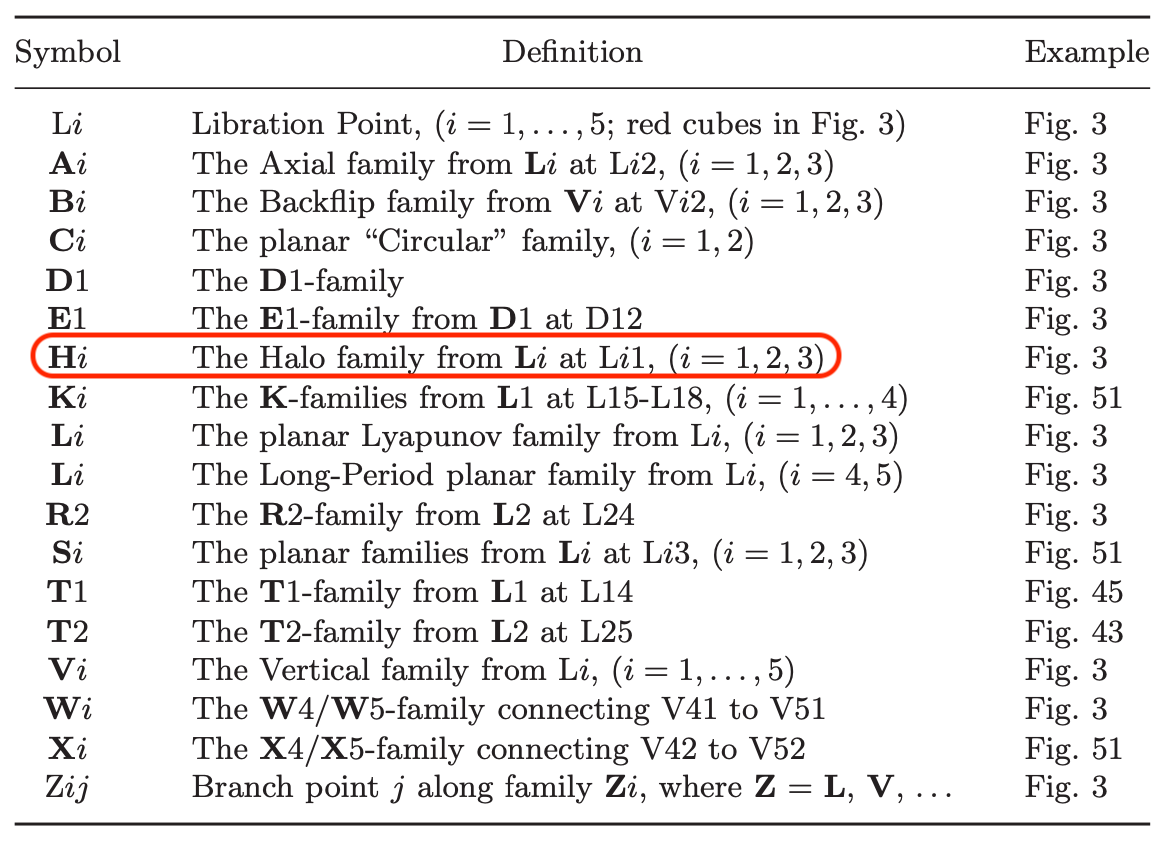

Table 1. Abbreviations used in this paper for orbit families and branch points.

Table 1. Abbreviations used in this paper for orbit families and branch points. Note that orbit families are denoted with boldface capital letters, while we do not use boldface letters for libration points and branch points. We also note that not all of these items need to be present for any specific value of μ
$\endgroup$

Your Answer

By clicking “Post Your Answer”, you agree to our terms of service and acknowledge you have read our privacy policy.

Not the answer you're looking for? Browse other questions tagged or ask your own question.