5
$\begingroup$

In this answer a table is showed with all the elements that were detected by the PIXL instrument on 2 occasions, namely sol 140 and sol 167.
As could be expected, X-ray counts were high for Si (1020232 and 168275 respectively) and for Ca (580670 and 1356676 respectively ).
But iron (Fe) was really an exception with values of 2940961 and 5212902 respectively.
PIXL2
PIXL instrument chart sample Credit:NASA/JPL-Caltech

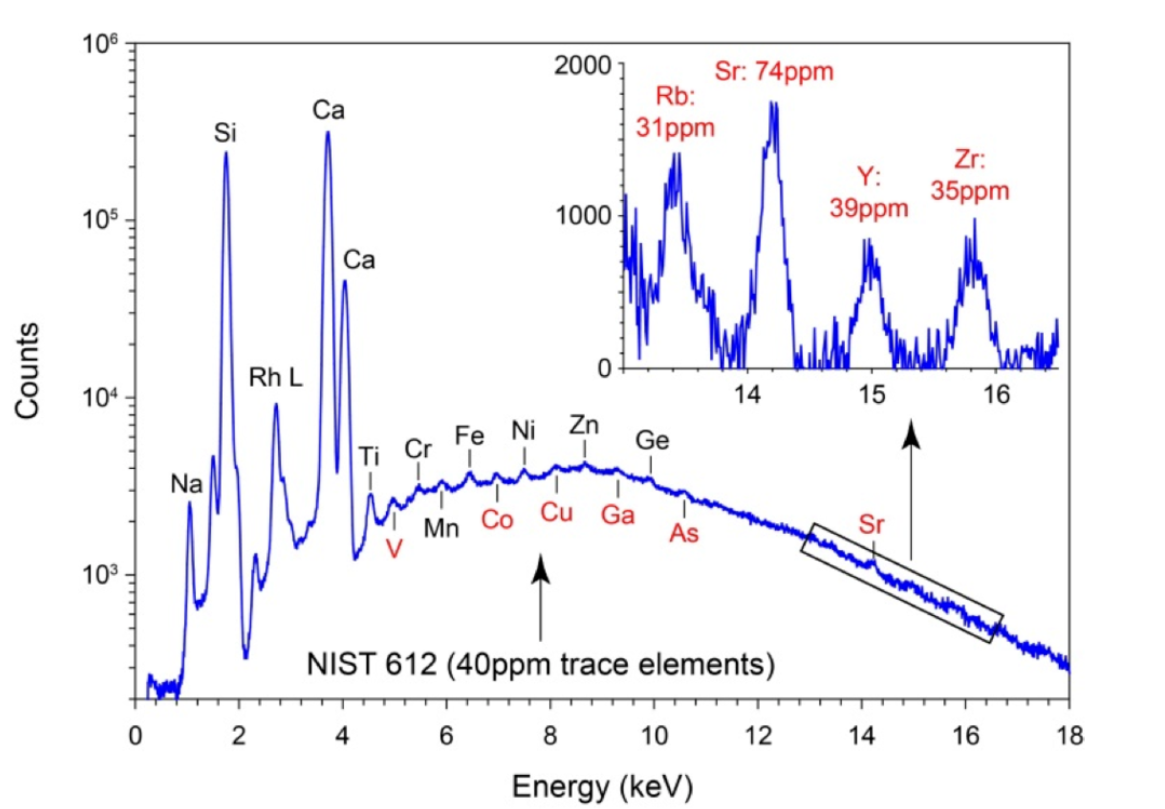
Looking at the chart sample above you could argue that the high Fe value is due to the "bulge" where the small peaks of Mn, Fe, Ni, Cu and Zn are situated, but then the "Top" X-ray counts in the table for Mn, Ni, Cu and Zn would have to be also high, but they are only 90854, 15684, 14117 and 14562 respectively. (sol 120)

Could the iron content of the abraded rock targets on both sol 120 and sol 167 really have been that high ?
Or is it possible that iron and/or its oxides re-emit X-rays more easily than other elements will do ?

$\endgroup$
10
  • 1
    $\begingroup$ Is it possible to convert counts into percentages of weight? $\endgroup$
    – Uwe
    Commented May 30, 2022 at 10:09
  • 1
    $\begingroup$ The "bulge" shouldn't play a role - background should be subtracted in the MSA data if I understand the documentation right. $\endgroup$
    – asdfex
    Commented May 30, 2022 at 11:14
  • 1
    $\begingroup$ @Uwe An X-ray count comes from one atom so I think the counts from the elements give the relative mole fraction. See en.wikipedia.org/wiki/Mole_fraction It seems possible to convert that to mass fraction. en.wikipedia.org/wiki/Mole_fraction#Mass_fraction $\endgroup$
    – Cornelis
    Commented May 30, 2022 at 11:34
  • 2
    $\begingroup$ I don't have a reference to point to at the moment, but x-ray fluorescence yields and XEOL yields do indeed vary by multiple orders of magnitude depending on the element in question. Certain transitions, like L2,3-edges vs other L-edges are dipole-allowed, occurring far more frequently. $\endgroup$
    – 0xDBFB7
    Commented May 30, 2022 at 14:41
  • 1
    $\begingroup$ (Note that I'm not an expert in this, could be wrong. Search for XAFS FLY vs energy tables to see what I mean). $\endgroup$
    – 0xDBFB7
    Commented May 30, 2022 at 14:43

3 Answers 3

8
$\begingroup$

To properly answer this question one would need to know what the X-ray counts signify in terms of quantities such as percent or parts per million of an element. For that, comparison with calibration values needs to be made. I'm assuming that prior to being sent to Mars, PIXL was calibrated using samples of known minerals.

It is well known that Mars is referred to as the red planet because of the amount of iron on the surface. Mars is very rusty. Many iron oxides are red in color, some are yellow.

The main iron ore minerals, on Earth, are

  • Magnetite (Fe3O4, 72.4% Fe)
  • Hematite (Fe2O3, 69.9% Fe)
  • Goethite (FeO(OH), 62.9% Fe)
  • Limonite (FeO(OH)·n(H2O), 55% Fe)
  • Siderite (FeCO3, 48.2% Fe)

Hematite was named so, because it is blood red in color. In earthy, compact fine grained material it is dull to bright red in color. Hematite has already been discovered on Mars; the so called blueberries. Note hematite contains 69.9% iron. That's a very high number.

The high X-ray counts for iron would indicate a localized high concentration of hematite.

$\endgroup$
5
  • $\begingroup$ Do you suggest that one element (say Fe) more easily re-emits X-rays then another ? (for instance Mn) Could you find evidence for that ? $\endgroup$
    – Cornelis
    Commented May 30, 2022 at 11:47
  • $\begingroup$ @Cornelis: Details of how PIXL has been calibrated will provide an answer to that. $\endgroup$
    – Fred
    Commented May 30, 2022 at 11:57
  • 1
    $\begingroup$ commons.wikimedia.org/wiki/… In this sample there are definitely a few spots with FeO being the most abundant material. $\endgroup$
    – asdfex
    Commented May 30, 2022 at 17:37
  • 1
    $\begingroup$ Keep in mind that Oxygen (and other light elements) are not visible for PIXL. All these minerals will show up as 100% iron. $\endgroup$
    – asdfex
    Commented May 30, 2022 at 17:38
  • $\begingroup$ @asdfex In this paper, hou.usra.edu/meetings/lpsc2022/pdf/1530.pdf , the results of 2 PIXL map scans on rock targets are presented, one of them on sol 120 when the very high Fe counts were recorded. $\endgroup$
    – Cornelis
    Commented May 31, 2022 at 11:22
4
$\begingroup$

A combination of things:

  1. Iron is highly abundant in solar system matter. Except perhaps for neon, all more abundant elements are outside PIXL's sensitive band.

  2. X-ray fluorescence favors elements of higher atomic number (Z). High Z elements are better at capturing the x-ray photons that PIXL's x-ray source emits. Their fluorescent yield is higher. The range of their fluorescent photons in matter is longer, so they are more likely to escape the sample and reach the detector.

  3. Elements with higher Z than iron are much rarer.

  4. PIXL uses silicon drift detectors (SDDs). Iron K fluorescence is in the "sweet spot" for SDD detection, where the detector quantum efficiency is almost 100%.

About the only reason not to see a lot of iron is that it's somewhat depleted in the crust, concentrated in the core of the planet.

$\endgroup$
2
$\begingroup$

X-ray spectrometer could had been not properly calibrated or the sample might had been contaminated. Here is a video material example, stamped at 10:26 where relevant part begins, in which a geologist is demonstrating his newly acquired X-ray spectrometer and X-raying rocks which had been subjected to an XRF assay by a professional company before. His private X-ray spectrometer detected around 13.5 ppm of lead ($\text{Pb}$), while the professional assay report gives the result of 42000 ppm of $\text{Pb}$ (more than 4 orders of magnitude higher). It ultimately has not been explained what the source of this discrepancy is, so I am referencing this example as a way to show that such mistakes could happen.

What is more, the detector's software might had been incomplete. Here is a video material example, stamped at 28:12 where the relevant part starts, in which a chemist talks about testing the gold bars after having refined the gold himself. First, he uses the service of a purity-testing company to test his nuggets in an X-ray spectrometer. The results came back saying the gold was 100% pure, but the chemist also asked for the detailed print-out report. He was quite surprised to discover that the report was telling the composition to be 99% gold and 1% tungsten. However, after having sought for more information about this strange reading, he had found the following explanation: tungsten and gold both have really similar density (which is also the reason why tungsten is used for the illicit manufacture of counterfeit gold bars) and have greatly similar peaks; if the XRF's software is not specialized in precious metals, it will read some of the gold content as tungsten. Similar situation also supposedly happens with iridium and lead: if one analyzes a lead sample with a small amount of impurities, the detector could read that as a mix of 1/2 part iridium and 1/2 part lead.

Another explanation relevant to my second example could be that X-ray bulbs used in XRF devices use tungsten filaments as electron sources. The filament gets heated, slowly evaporates consumed slowly, possibly leading to the depletion of tungsten atoms on the anode and thus to parasitic tungsten peaks in the detected spectrum that can get scattered and find a way into the final resulting spectrum. I suppose that an analogous phenomenon could had happened with the iron content present in the XRF device's constituting parts, and had artificially increased the numbers of counts.

Having considered that, the anomalously high iron content could had been a result of XRF device's miscalibration, parasitic peaks from the iron content of the device itself, software error, or contamination of the sample.
$\endgroup$
5
  • 1
    $\begingroup$ The published table is counts. It's uncalibrated data. $\endgroup$
    – John Doty
    Commented May 31, 2022 at 12:53
  • $\begingroup$ @JohnDoty Which table to you refer to? They have a 3-letter-code. Raw data has an 'E' as first letter, calibrated data has an 'R'. $\endgroup$
    – asdfex
    Commented May 31, 2022 at 17:31
  • $\begingroup$ The data quoted in the OP is counts. $\endgroup$
    – John Doty
    Commented May 31, 2022 at 17:43
  • $\begingroup$ 'counts' doesn't tell anything about calibration. $\endgroup$
    – asdfex
    Commented May 31, 2022 at 18:35
  • $\begingroup$ The channels have been calibrated, see the header of the files I used for the table. $\endgroup$
    – Cornelis
    Commented May 31, 2022 at 19:19

Your Answer

By clicking “Post Your Answer”, you agree to our terms of service and acknowledge you have read our privacy policy.

Not the answer you're looking for? Browse other questions tagged or ask your own question.