6
$\begingroup$

I've been working on a design for a sounding rocket that can go to the Karman line, that I want to make my senior capstone project next year. As a part of this process, I am making a program to estimate the maximum altitude attained by the rocket and its going pretty well.

Here is the estimated flight for a 1000lbf engine with 120 lbs of total rocket and 80% fuel by weight: enter image description here
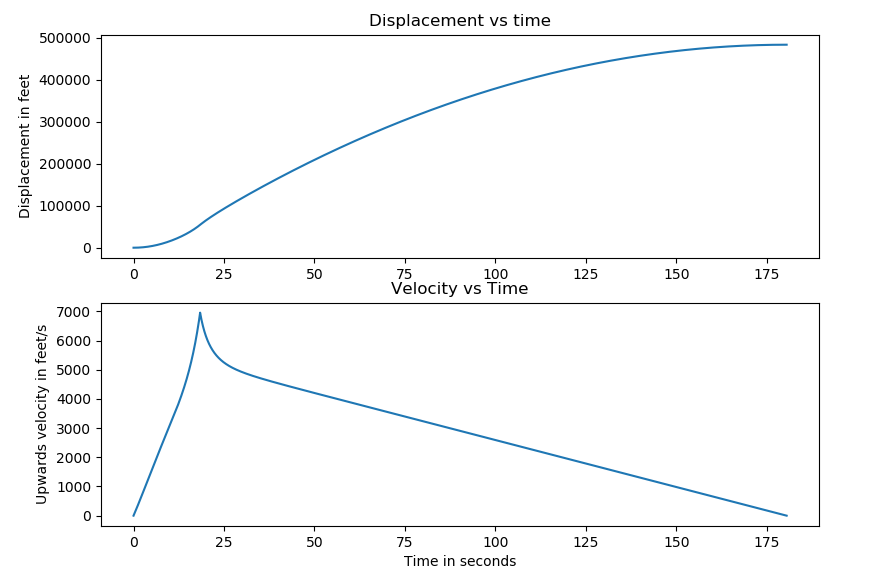
However, the current estimation I have is still a huuuuuge over estimation because it does not consider the effects of trans and supersonic flight on the coefficient of drag, which I imagine will have a dramatic impact on this code's output (notice the max velocity is 6800 ft/s...)

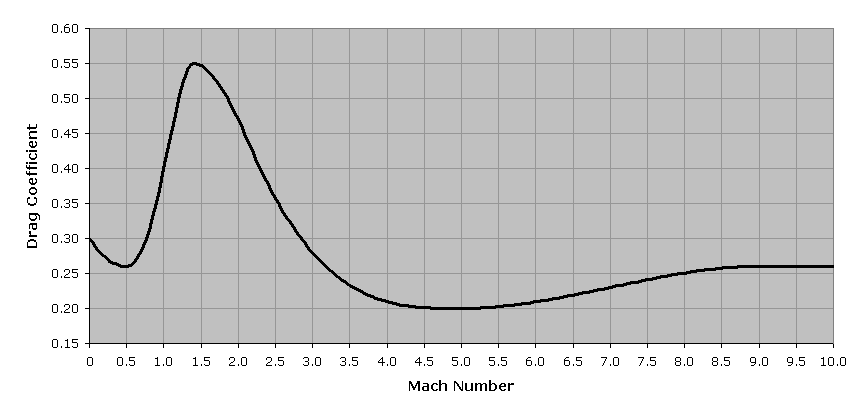
I was able to find this image relating atlas Cd to mach number here:

enter image description here

See this answer and way back machine for source.

How can I make a curve similar to this for our project? The rocket body is going to be a (ogive or parabolic probably) cone with a long cylindrical body and fins. I estimate that the Cd will be about .2-.25 at low speed flight.

How can I go about making a curve like this? How do I know at what mach number the pressure will be highest for my design? Should I change nose-cone shape to reduce drag at sonic speed? Are there any resources to guide me in the right direction here? Any advice would be greatly appreciated. We have access to a pretty slow wind tunnel and fluid dynamics software if that can help us any.

Thanks!
$\endgroup$
7
  • $\begingroup$ How fast is a "pretty slow" wind tunnel? $\endgroup$ Commented Nov 25, 2018 at 3:25
  • $\begingroup$ @RussellBorogove I've added a link to one of your answers (as source for the figure). $\endgroup$
    – uhoh
    Commented Nov 25, 2018 at 4:06
  • 2
    $\begingroup$ Welcome to Space, and congratulations on writing our 9000th question! $\endgroup$
    – DrSheldon
    Commented Nov 25, 2018 at 6:11
  • 2
    $\begingroup$ I don't have a definitive answer, but this paper on supersonic aerodynamics might be helpful. I note that figure 10-9 shows many aircraft having a generally similar Cd vs mach curve up to M2.0 that is not too dissimilar from the Atlas data. While you're waiting for a better answer you could do worse than estimating a curve based on those models and your low-speed data... $\endgroup$ Commented Nov 27, 2018 at 20:51
  • 1
    $\begingroup$ Not an answer to your question, but you can find data from a similar flight at the CSXT web site: ddeville.com/GoFast_Flight_data.xls That the velocity curve doesn't have the sharp cusp that yours does, which makes me wonder where that comes from. (The main CSXT page describes the rocket: ddeville.com/derek/CSXT.htm) $\endgroup$ Commented Nov 28, 2018 at 8:37

0

Your Answer

By clicking “Post Your Answer”, you agree to our terms of service and acknowledge you have read our privacy policy.