There is a map of lunar pits, created by R. V. Wagner and M. S. Robinson of the School of Earth and Space Exploration, Arizona State University, in 2014. From Distribution, Age, and Formation Mechanisms of Lunar Pits (PDF) by mentioned authors:

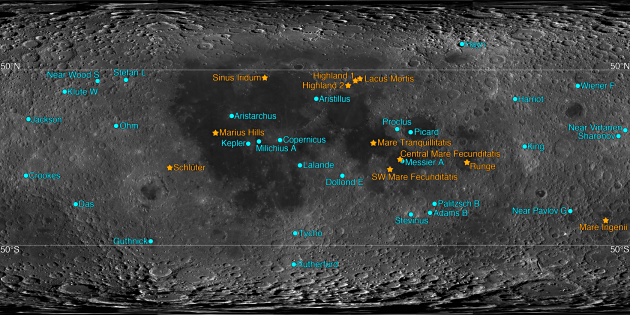
Map of the locations of all currently-known pits. Orange stars
indicate mare or highland pits, and blue dots indicate craters with
impact melt pits. 50° lines mark PitScan's search range.
Click on the image for a higher resolution version. Complete list with locations should be available in the Distribution, formation mechanisms, and significance of lunar pits Icarus volume by same authors, but is paywalled. From its highlights:
- We developed an algorithm to search for collapse pits in LROC NAC images.
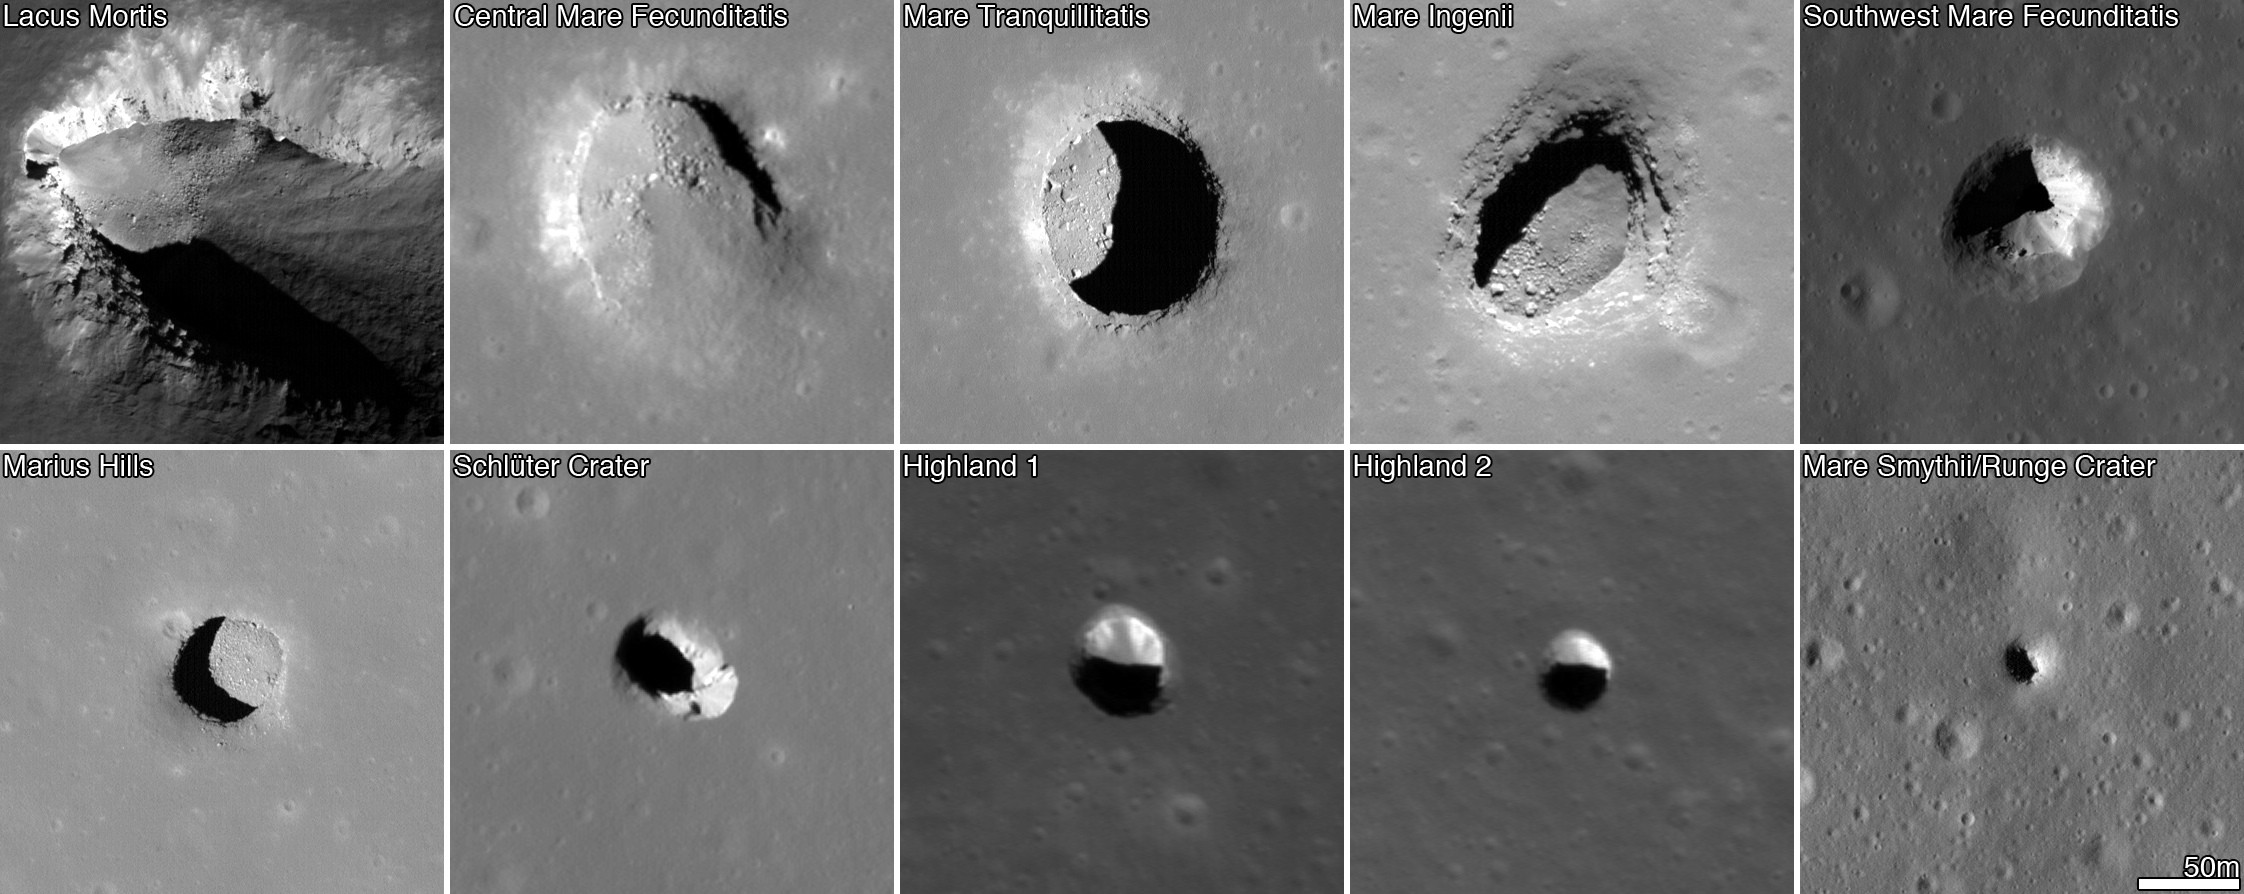
- We found ten pits in maria and highlands, typically 40–100 m in diameter and depth.
- We found over 200 pits in impact melt, which average 16 m in diameter and 7 m in depth.
- Pits are often significantly younger than their host materials.
- Some pits have confirmed overhangs, and may connect to larger sublunarean voids.
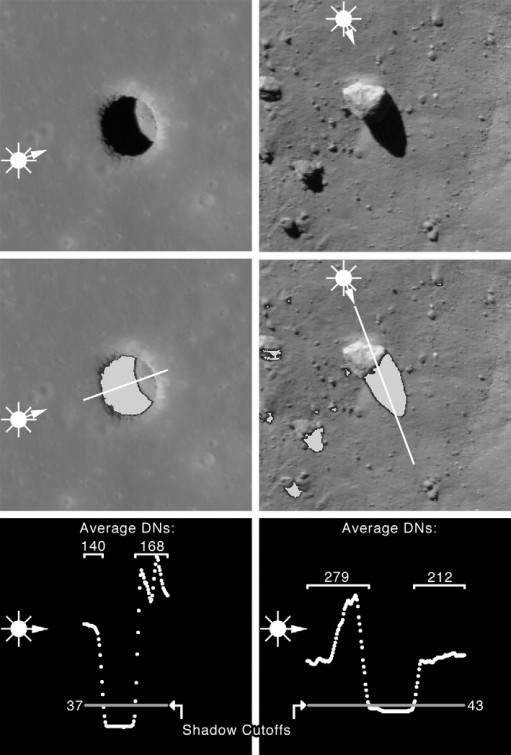
Authors have searched for lunar pits with own PitScan, a semi-automated search algorithm that scanned LROC NAC images for pit candidates, and 200x200 pixel crops were created for human confirmation. The algorithm went through a three-step process:
- Determine a cut-off value for what is “shadowed” in the image.
- Locate all blocks of "shadowed" pixels more than 10 pixels across.
For each such block of pixels, determine if the up-Sun or down-Sun side of the shadow is brighter. If the up-Sun side is brighter, then
it is probably a rock, and should be ignored (see figure). Otherwise,
save a small image of the shadow for classification by a human.

Comparison of PitScan output for a pit (left) and a rock (right). Note the relative brightnesses of the up-Sun and down-Sun regions of the DN profiles (bottom panels).
About that RDR, it stands for Reduced Data Record and is described in this LROC page:
LROC utilizes more than one million images we've colleted in a
variety of data products. An EDR (Engineering Data Record) is an image
and its associated metadata. A CDR is and EDR that has been
decompanded and calibrated. An RDR (Reduced Data Record) can be made
from as few as one image or as many as thousands that are processed
and reduced for the purpose of, for example, making a mosaic that
combines multiple images of a particular area or feature, or a high
resolution global digital elevation model created with stereo
observations.
There are many way to search through LROC's Data products:
More info about lunar pits from Lunar and Planetary Science Conferences (this was bugging me because I couldn't remember where I saw talks on the topic):
Lunar Pits: Sublunarean Voids And The Nature Of Mare Emplacement (A. K. Boyd et al., 42nd LPSC 2012, PDF). Includes a LROC image table of some of them:
Location             Image        Depth  Shadow  Diameter   Slew  Incidence
                                    (m)  length  Max  Min  angle      angle
                                            (m)  (m)  (m)    (°)        (°)
▬▬▬▬▬▬▬▬▬▬▬▬▬▬▬▬▬▬▬▬▬▬▬▬▬▬▬▬▬▬▬▬▬▬▬▬▬▬▬▬▬▬▬▬▬▬▬▬▬▬▬▬▬▬▬▬▬▬▬▬▬▬▬▬▬▬
Mare Tranquilitatis  M106662246R    102      60   97   86   0.00      30.52
                     M126710873R    106      53   95   85   0.00      26.56
                     M137332905R     92      70   98   81   7.05      37.37
                     M144395745L     NM      NM  100   NM -50.46      47.92
———————————————————————————————————————————————————————————————————————————
Marius Hills         M114328462R    >32*     NM   62   48   6.80      61.38
                     M122584310L     36      19   57   46   0.00      28.08
                     M133207316L     >8*     NM   76   61  29.13      82.84
                     M137929856R     NM      NM   NM   NM  42.86      33.79
———————————————————————————————————————————————————————————————————————————
Mare Ingenii         M115225180L    >24      NM  146  107   0.00      74.52
                     M121124338L     68      87  125   97   0.00      52.00
                     M123485893R     47      38  104   68  -5.45      39.05
                     M128202846L     76     105  125   68   0.00      54.25
                     M136465172L    >47*     NM  110   73  15.51      55.47
                     M138819477R     52      42  101   73   0.00      38.91
▬▬▬▬▬▬▬▬▬▬▬▬▬▬▬▬▬▬▬▬▬▬▬▬▬▬▬▬▬▬▬▬▬▬▬▬▬▬▬▬▬▬▬▬▬▬▬▬▬▬▬▬▬▬▬▬▬▬▬▬▬▬▬▬▬▬
* depth estimate less certain due to high slew angles
NM not measureable
You can load images with LROC Image Search if you copy the image name in the Product ID field, but sadly this source doesn't provide exact coordinates and images cover large areas and features discussed are tiny in comparison.
Electromagnetic Simulations of Ground-Penetrating Radar Propagation near Lunar Pits and Lava (M. I. Zimmerman et al., 44th LPSC 2014, PDF). Just an interesting read. Carry on. :)
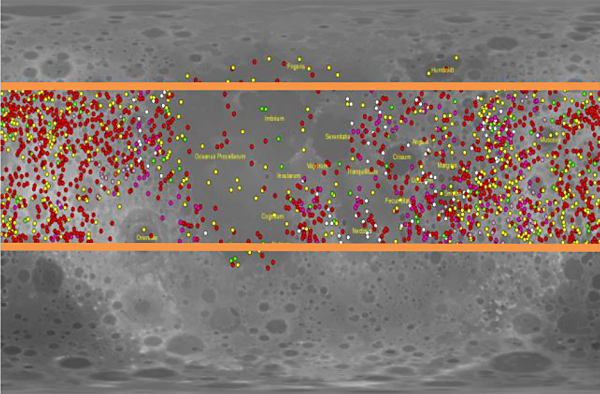
A Reevaluation of Lunar Impact Pit Craters (P. T. Malinski et al., 45th LPSC 2015, PDF). Includes a map of surveyed pits using Lunar Orbiter Laser Altimeter (LOLA) data, which is another way to detect them, as we discussed in the chat:
 LOLA generated lunar surface with surveyed pits (dots). The lines represent borders and the area between the lines represent the
area survey for the lunar highlands. Maria that fell within the
highland study area were evaluated based upon their natural borders.


 LOLA generated lunar surface with surveyed pits (dots). The lines represent borders and the area between the lines represent the
area survey for the lunar highlands. Maria that fell within the
highland study area were evaluated based upon their natural borders.