33
$\begingroup$

This tweet from India's prime minister Narendra Modi says:

मेरे प्यारे देशवासियों,

आज सवेरे लगभग 11.45 - 12.00 बजे मैं एक महत्वपूर्ण संदेश लेकर आप के बीच आऊँगा।

I would be addressing the nation at around 11:45 AM - 12.00 noon with an important message.

Do watch the address on television, radio or social media.

There are several subsequent tweets with more specifics, including this one:

In the journey of every nation there are moments that bring utmost pride and have a historic impact on generations to come.

One such moment is today.

India has successfully tested the Anti-Satellite (ASAT) Missile. Congratulations to everyone on the success of #MissionShakti.

Question: At what range of altitudes is the resulting debris field?

note: I'm not asking for just a guess or speculation, please include a source of some type.


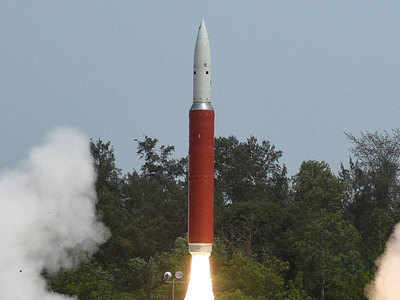
YouTube: DRDO's Anti Satellite (A-SAT) Test Visuals

From Times of India's Watch: Launch of anti-satellite missile for Mission Shakti:

India ASAT

Hat tip to @Ohsin for recommending this interesting video about the rocket, and the test itself:

$\endgroup$
6

5 Answers 5

34
$\begingroup$

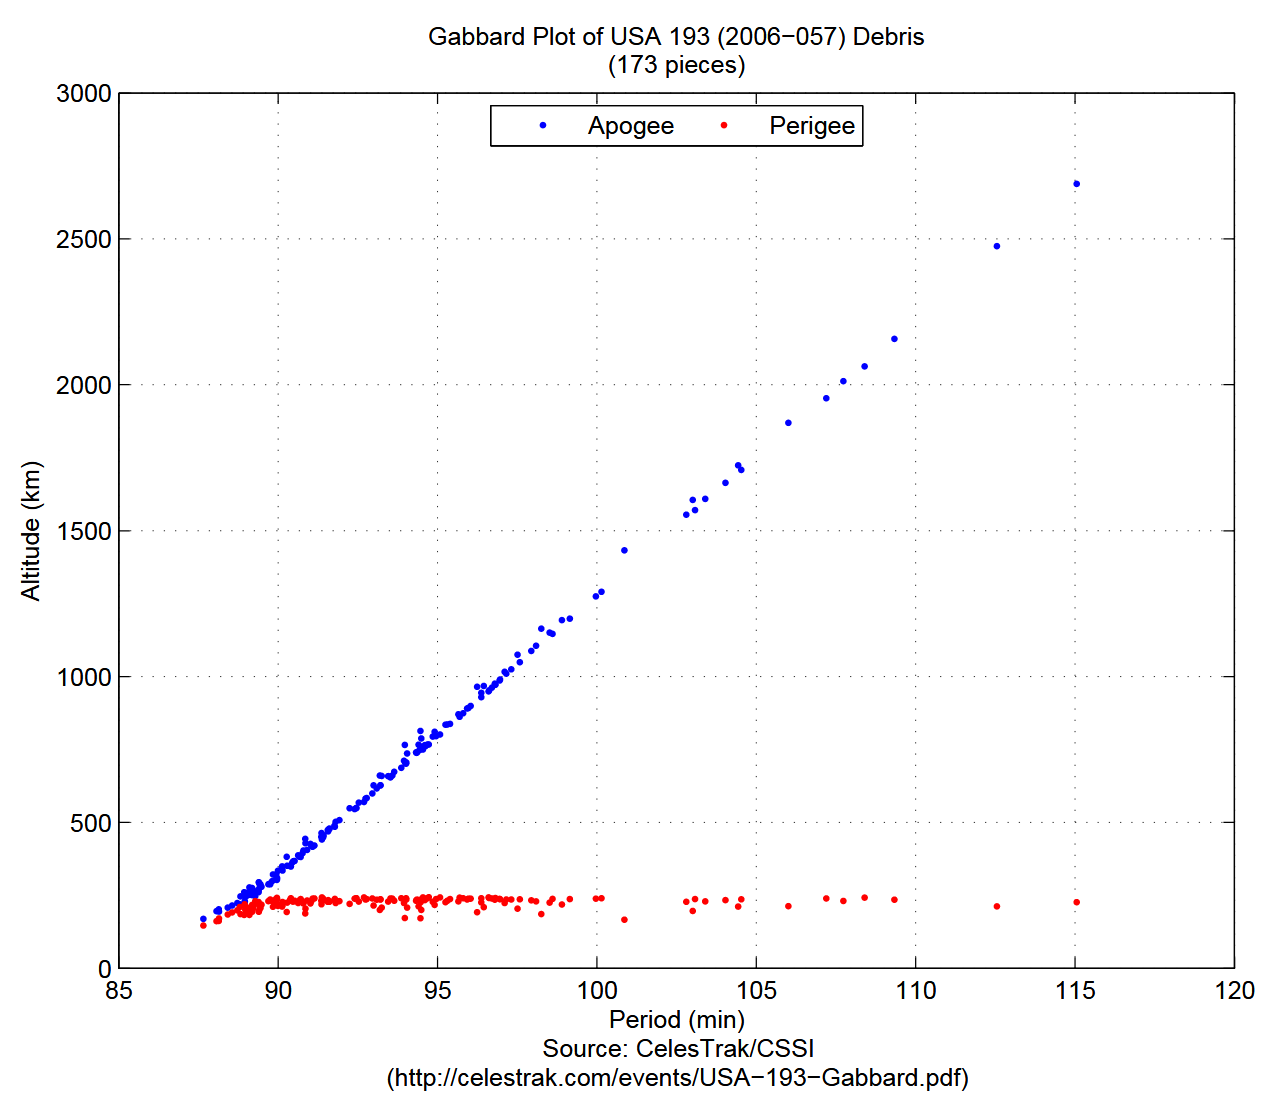
The apogee/ perigee of 2019-006A, the object likely shot down, was 260- 282 km, pretty low. Some of that debris could be quite a bit higher, but most of it will be lower, and all of it will have a new perigee/ apogee in that range, which will likely be shrinking quickly. It is expected that it will be similar to the debris cloud from USA-193 (Operation Burnt Frost), which had the following debris cloud Gabbard Plot (From Celestrak). Note that all debris reentered within 18 months after that operation, and most within a few days. I suspect it won't be quite as energetic, as there presumably isn't as much fuel quick could cause a significant energy event, but it's the best we have for now.

enter image description here

The best place to look would be from Space-Track's new catalog objects not associated with a launch. That data should be available soon. If you want to follow someone on Twitter to find out more, I recommend Jonathan McDowell

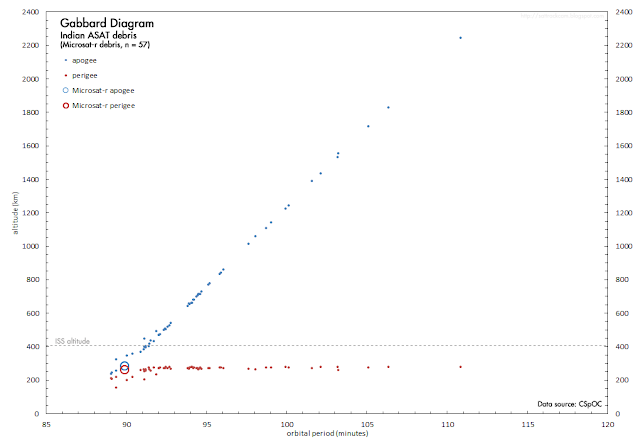
Edit: The first Gabbard Plot has been made for this event, from this source. Looks like it is going quite high.

enter image description here

$\endgroup$
3
  • 1
    $\begingroup$ it is important to note that the Gabbard plots made from Space-Track data typically only include those objects greater than 10cm in size (though there is certainly small debris created in such an event). Small debris may have even higher apogees, but we can't see it (easily)! $\endgroup$
    – costrom
    Commented Aug 30, 2019 at 18:05
  • 1
    $\begingroup$ True, but small debris will tend to not stick around as long, as it will usually fall more easily to aerodynamic forces. $\endgroup$
    – PearsonArtPhoto
    Commented Aug 31, 2019 at 23:52
  • 1
    $\begingroup$ I completely agree. It would be interesting to see how high the mm-size breakup cloud component goes though :) $\endgroup$
    – costrom
    Commented Sep 3, 2019 at 13:26
15
$\begingroup$

At this time, it is not yet known. There are some 250 objects observed, but it takes time to catalog them all. The object destroyed was most likely MICROSAT-R (TLE catalog number 43947, which is in a 294 x 265 km orbit at 96 degrees inclination.

Due to the nature of the event, it's likely some of the objects have apogees well above ISS orbit. At this time, there is little to no public data available. When it comes available, you can expect to see it at space-track.org and celestrak.org in addition to the twitter account @TSKelso.

$\endgroup$
5
  • 1
    $\begingroup$ as if a box full of marbles wasn't enough for you guys to worry about already. $\endgroup$
    – uhoh
    Commented Mar 27, 2019 at 14:43
  • 4
    $\begingroup$ At least this debris field is expected to be short-lived, unlike the Chinese ASAT test. $\endgroup$
    – Tristan
    Commented Mar 27, 2019 at 15:02
  • 3
    $\begingroup$ Not sure if the debris cloud will be short-lived, since it is a low solar activity period. $\endgroup$
    – Harish
    Commented Mar 27, 2019 at 17:26
  • 4
    $\begingroup$ Even at nearly record low solar activity, orbit lifetimes with perigees below 300 km are many orders of magnitude shorter than those at 900-ish km. $\endgroup$
    – Tristan
    Commented Mar 28, 2019 at 14:58
  • $\begingroup$ As of 13:46 UTC on 29 March 2019, no TLEs related to the event have been released. $\endgroup$
    – Tristan
    Commented Mar 29, 2019 at 13:47
5
$\begingroup$

At what altitude range is the resulting debris field?

Update:

CNN: India anti-satellite missile test a 'terrible thing,' NASA chief says

India's anti-satellite missile test created at least 400 pieces of orbital debris, the head of NASA says -- placing the International Space Station (ISS) and its astronauts at risk.

NASA administrator Jim Bridenstine said Monday that just 60 pieces of debris were large enough to track. Of those, 24 went above the apogee of the ISS, the point of the space station's orbit farthest from the Earth.

"That is a terrible, terrible thing to create an event that sends debris at an apogee that goes above the International Space Station," Bridenstine said in a live-streamed NASA town hall meeting. "That kind of activity is not compatible with the future of human spaceflight."

He added: "It is not acceptable for us to allow people to create orbital debris fields that put at risk our people."

See also Ars Technica's India ASAT test debris poses danger to International Space Station, NASA says (hat tip @Machavity)

You can see and hear the complete question and answer in the new NASA video of the Town Hall with NASA Administrator Jim Bridenstine appropriately coincidentally released on April Fools Day 2019, starting at 07:40:


Original answer:

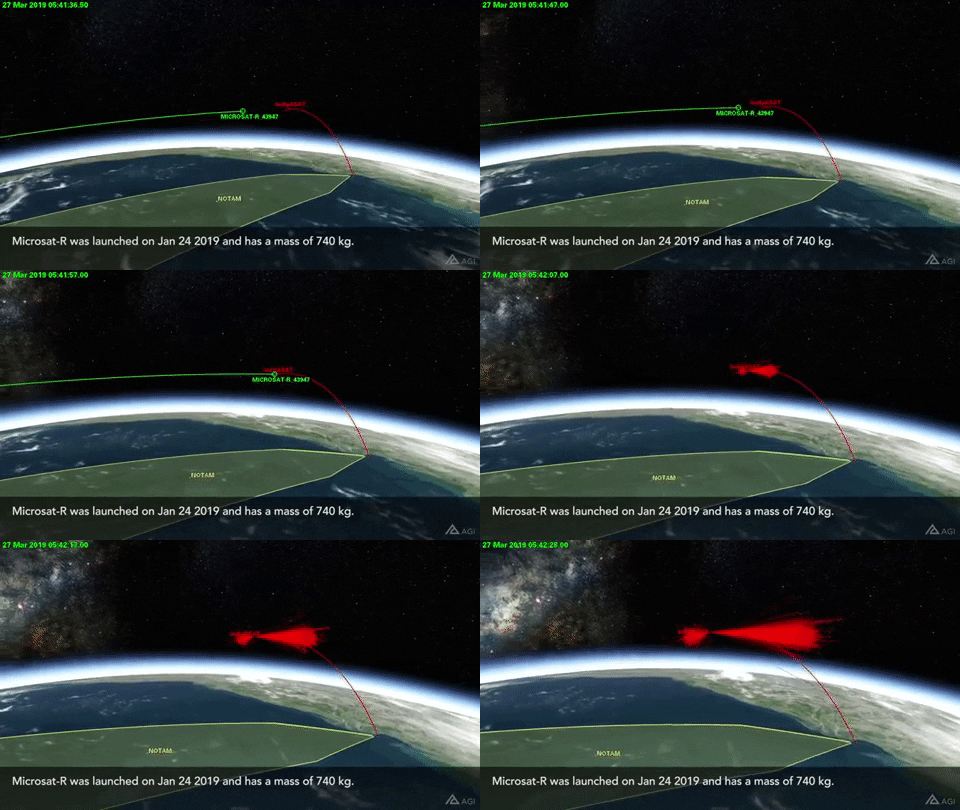
After about 05:00 in Scott Manley's video Updates - JPL Visit, Mars 2020, Moon in 5 Year, EVA Changes, Indian ASAT he talks about the test and in the video notes he links to the Analytical Graphics video 2019 Indian Anti-Satellite Weapon Test - Updated. The video mentions

  • Breakup generated by DEBBIE tool implementation of ESA-enhanced NASA Standard Breakup Model 2004.
  • Approximately 6500 fragments larger than 0.5 cm produced.

and the animation shows many debris fragments going 1000 km or higher, in elliptical orbits.

The ISS at 400 km will then definitely be intersecting this collision plane twice every 93 minutes at an altitude capable of intercepting some of these fragments.

India Anti-satellite missile ASAT test

India Anti-satellite missile ASAT test

$\endgroup$
4
3
$\begingroup$

I'll just follow up a bit on the collision.

Per tweet and tweet and answer and answer and post:

  • launch 5:40 UT (27 March 2019)
  • MICROSAT-r 43947, 2019-006A
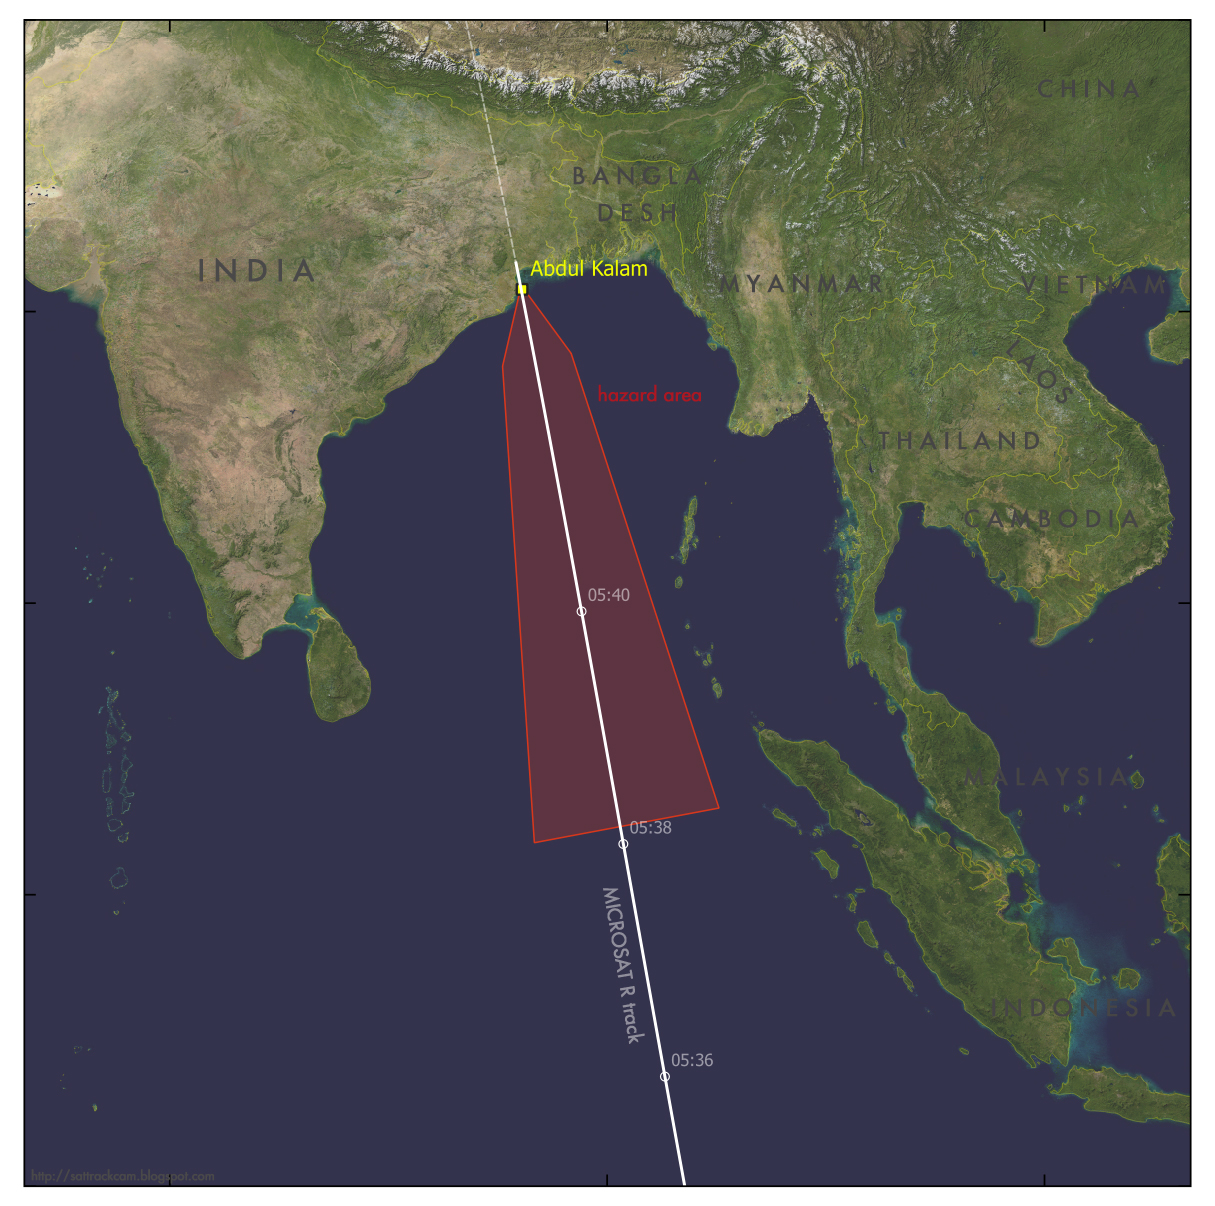
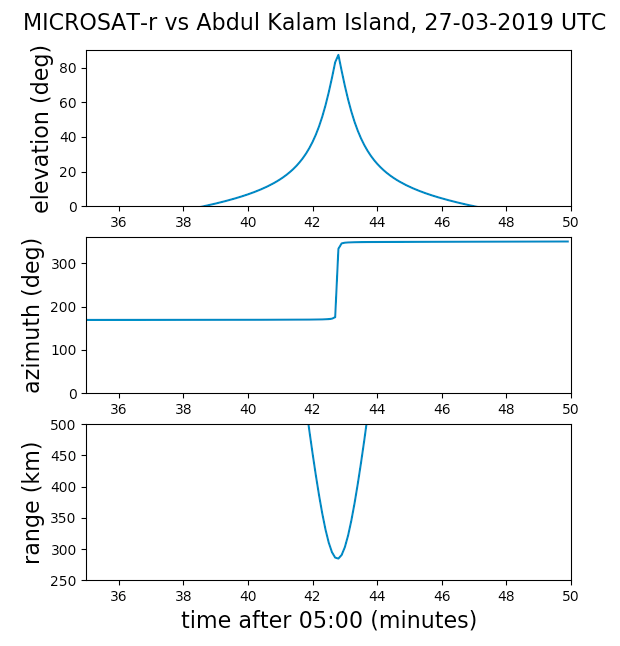
  • over Abdul Kalam Island 5:42 UT

I've put a recent TLE into Skyfield and we can see that the satellite was moving north from the equator towards Abdul Kalam Island, India. According to the image in India's surprise ASAT test of 27 March 2019 the launch was somewhat south over the ocean to meet it.

At 05:42 the altitude was about 281 km and the velocity 7.73 km/s.

MICROSAT-R              
1 43947U 19006A   19086.74388517  .07448791  20151+0  12875-1 0  9992
2 43947  96.7526   0.1883 0022976 252.9519 167.8627 16.09438738  9918
enter image description here

enter image description here Source

# https://celestrak.com/satcat/
TLE = """MICROSAT-R              
1 43947U 19006A   19086.74388517  .07448791  20151+0  12875-1 0  9992
2 43947  96.7526   0.1883 0022976 252.9519 167.8627 16.09438738  9918"""
name, L1, L2 = TLE.splitlines()

# https://twitter.com/DutchSpace/status/1110833431523545088
# https://twitter.com/Marco_Langbroek/status/1110861054010105858
# https://sattrackcam.blogspot.com/2019/03/indias-surprise-asat-test-of-27-march.html
# launch 5:40 UT (27 March 2019)
# over  5:42 UT on 27 March 2019
# Abdul Kalam island on the Indian East Coast
# 20.757N, 87.084E

import numpy as np
import matplotlib.pyplot as plt
from skyfield.api import Topos, Loader, EarthSatellite

load  = Loader('~/Documents/fishing/SkyData')  # single instance for big files
ts    = load.timescale()
de421 = load('de421.bsp')
earth = de421['earth']

Abdul_Kalam_Island  = earth + Topos(latitude_degrees    = +20.757,
                                    longitude_degrees   = +87.084,
                                    elevation_m         =  10.0)
minutes             = np.arange(35, 50, 0.1)
times               = ts.utc(2019, 3, 27, 5, minutes)

MICROSAT_r          = earth + EarthSatellite(L1, L2)

astrometric         = Abdul_Kalam_Island.at(times).observe(MICROSAT_r)
alt, az, d          = astrometric.apparent().altaz(pressure_mbar=0)

pos_42 = earth.at(ts.utc(2019, 3, 27, 5, 42)).observe(MICROSAT_r).position.km
vel_42 = earth.at(ts.utc(2019, 3, 27, 5, 42)).observe(MICROSAT_r).velocity.km_per_s

r      = np.sqrt((pos_42**2).sum())
v      = np.sqrt((vel_42**2).sum())
print pos_42
print r
print r - 6378.137
print v

if True:
    plt.figure()
    plt.subplot(3, 1, 1)
    plt.plot(minutes, alt.degrees)
    plt.ylabel('elevation (deg)', fontsize=16)
    plt.ylim(0, 90)
    plt.xlim(35, 50)

    plt.subplot(3, 1, 2)
    plt.plot(minutes, az.degrees)
    plt.ylabel('azimuth (deg)', fontsize=16)
    plt.ylim(0, 360)
    plt.xlim(35, 50)

    plt.subplot(3, 1, 3)
    plt.plot(minutes, d.km)
    plt.ylabel('range (km)', fontsize=16)
    plt.xlabel('time after 05:00 (minutes)', fontsize=16)
    plt.ylim(250, 500)
    plt.xlim(35, 50)

    plt.suptitle('MICROSAT-r vs Abdul Kalam Island, 27-03-2019 UTC', fontsize=16)
    plt.show()
$\endgroup$
2
$\begingroup$

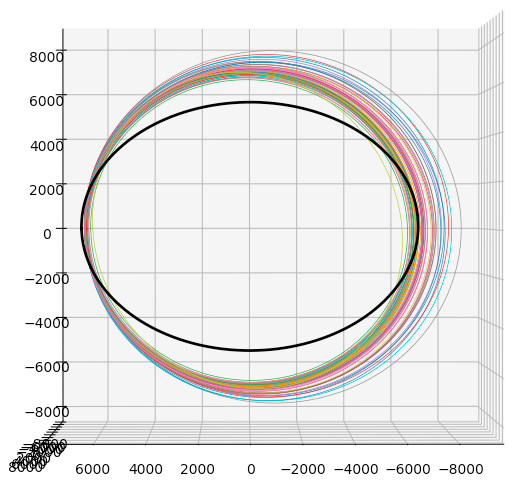
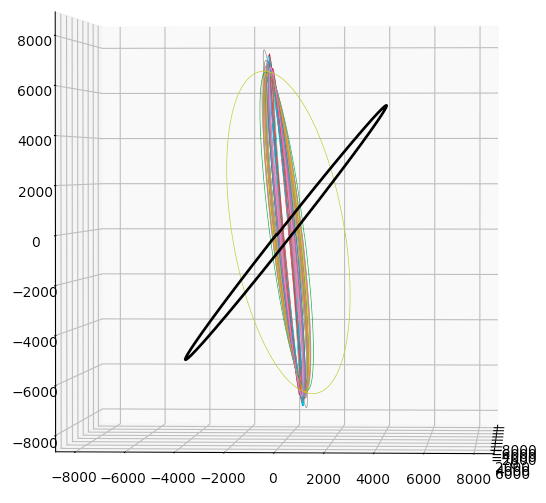
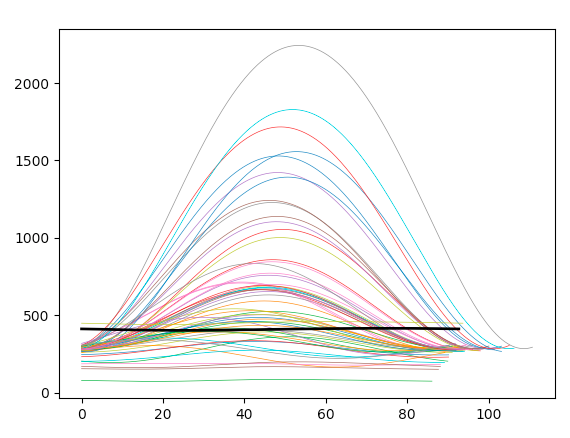
Thanks to @Ohsin's comment I have plotted the propagated orbits of 57 tracked debris objects with published TLEs as well as the TLE for (whatever is left of) the original spacecraft and the original rocket body, as well as for the ISS.

You can see that most of the debris still has a low periapsis where it was created, but a lot of it has aopapsis of 1000 to 2000 kilometers. Of course the downward scattered objects immediately burned up in the atmosphere, so the distribution is asymmetrical.

Much of these remaining large pieces intersect the altitude of the ISS twice per orbit.

The first two plots are the 3D orbits, the thick black line is the ISS's inclined orbit. Two rotated views are shown because Stack Exchange doesn't support WebGL yet (also and also), and neither do I yet.

The last plot is altitude versus time (minutes) starting at the ascending node of each object separately. Obviously the objects with a higher apoapsis have a longer period.

In all plots, the thick black line is the ISS.

Python script: https://pastebin.com/X7u0RZWR

India ASAT test debris versus ISS

India ASAT test debris versus ISS

India ASAT test debris versus ISS

$\endgroup$

Your Answer

By clicking “Post Your Answer”, you agree to our terms of service and acknowledge you have read our privacy policy.

Not the answer you're looking for? Browse other questions tagged or ask your own question.