16
$\begingroup$

In the final phase of the Apollo landings, the commander would go into "P66 attitude hold" mode, where the computer maintained a steady rate of descent while allowing the commander to change the orientation of the spacecraft to steer to a good landing site. The rate of descent could be adjusted in one-foot-per-second increments, and the goal would be to touch down at around 3 fps or less.

During this phase, the lunar module pilot would call out altitude and descent rates (as well as horizontal rates and other useful information) so that the commander could keep his eyes on the terrain. Occasionally the LMP would suggest speeding up or slowing down the descent. The dangers of coming down too fast are obvious, but coming down too slowly runs the risk of depleting the fuel in the descent stage. Some examples:

Apollo 14 (Shepard/Mitchell):

108:13:44 Mitchell: 170 feet and holding (altitude). About 1 foot per second down. You want to speed it up a little bit.

Apollo 17 (Cernan/Schmitt):

113:00:42 Schmitt: 300 feet, 15 feet per second. A little high. H-dot's a little high.

113:00:55 Schmitt: Okay; 9 feet per second down at 200. Going down at 5. Going down at 5. Going down at 10 (fps); cut the H-dot. The fuel's good. 110 feet. Stand by for some dust. Little forward, Gene.

H-dot refers to the descent rate.

Apollo 12 (Conrad/Bean):

110:31:23 Bean: Ten percent fuel. 200 feet; coming down at 3. (You) need to come on down.

Apollo 16 (Young/Duke):

104:28:45 Duke: Okay, 200 feet, 11 (fps) down. Give me a couple of clicks up.

104:29:08 Duke: Okay, 80 feet, down at 3. Looking super. There's dust. (Pause) Okay, down at 3. 50 feet, down at 4. Give me one click up. You're backing up slightly. (Pause)

Clicking the rate of descent switch upward would slow the descent, so these are surprisingly direct recommendations.

An annotation from Charlie Duke in the A16 flight journal regarding the 200 foot call strongly indicates that there was a standardized descent rate schedule:

["He's going down too fast. Okay? And our profile calls for 5 foot per second, H-dot; and he's 11. And 12 was our maximum. And, so, I wanted him to slow down a little bit. We were sinking too fast. I wanted to get him closer back to profile."]

Can someone find the descent rate profile that Duke is referring to here? Did LMPs look at a cheat sheet during the descent, or would they memorize key altitude-versus-ROD reference points?

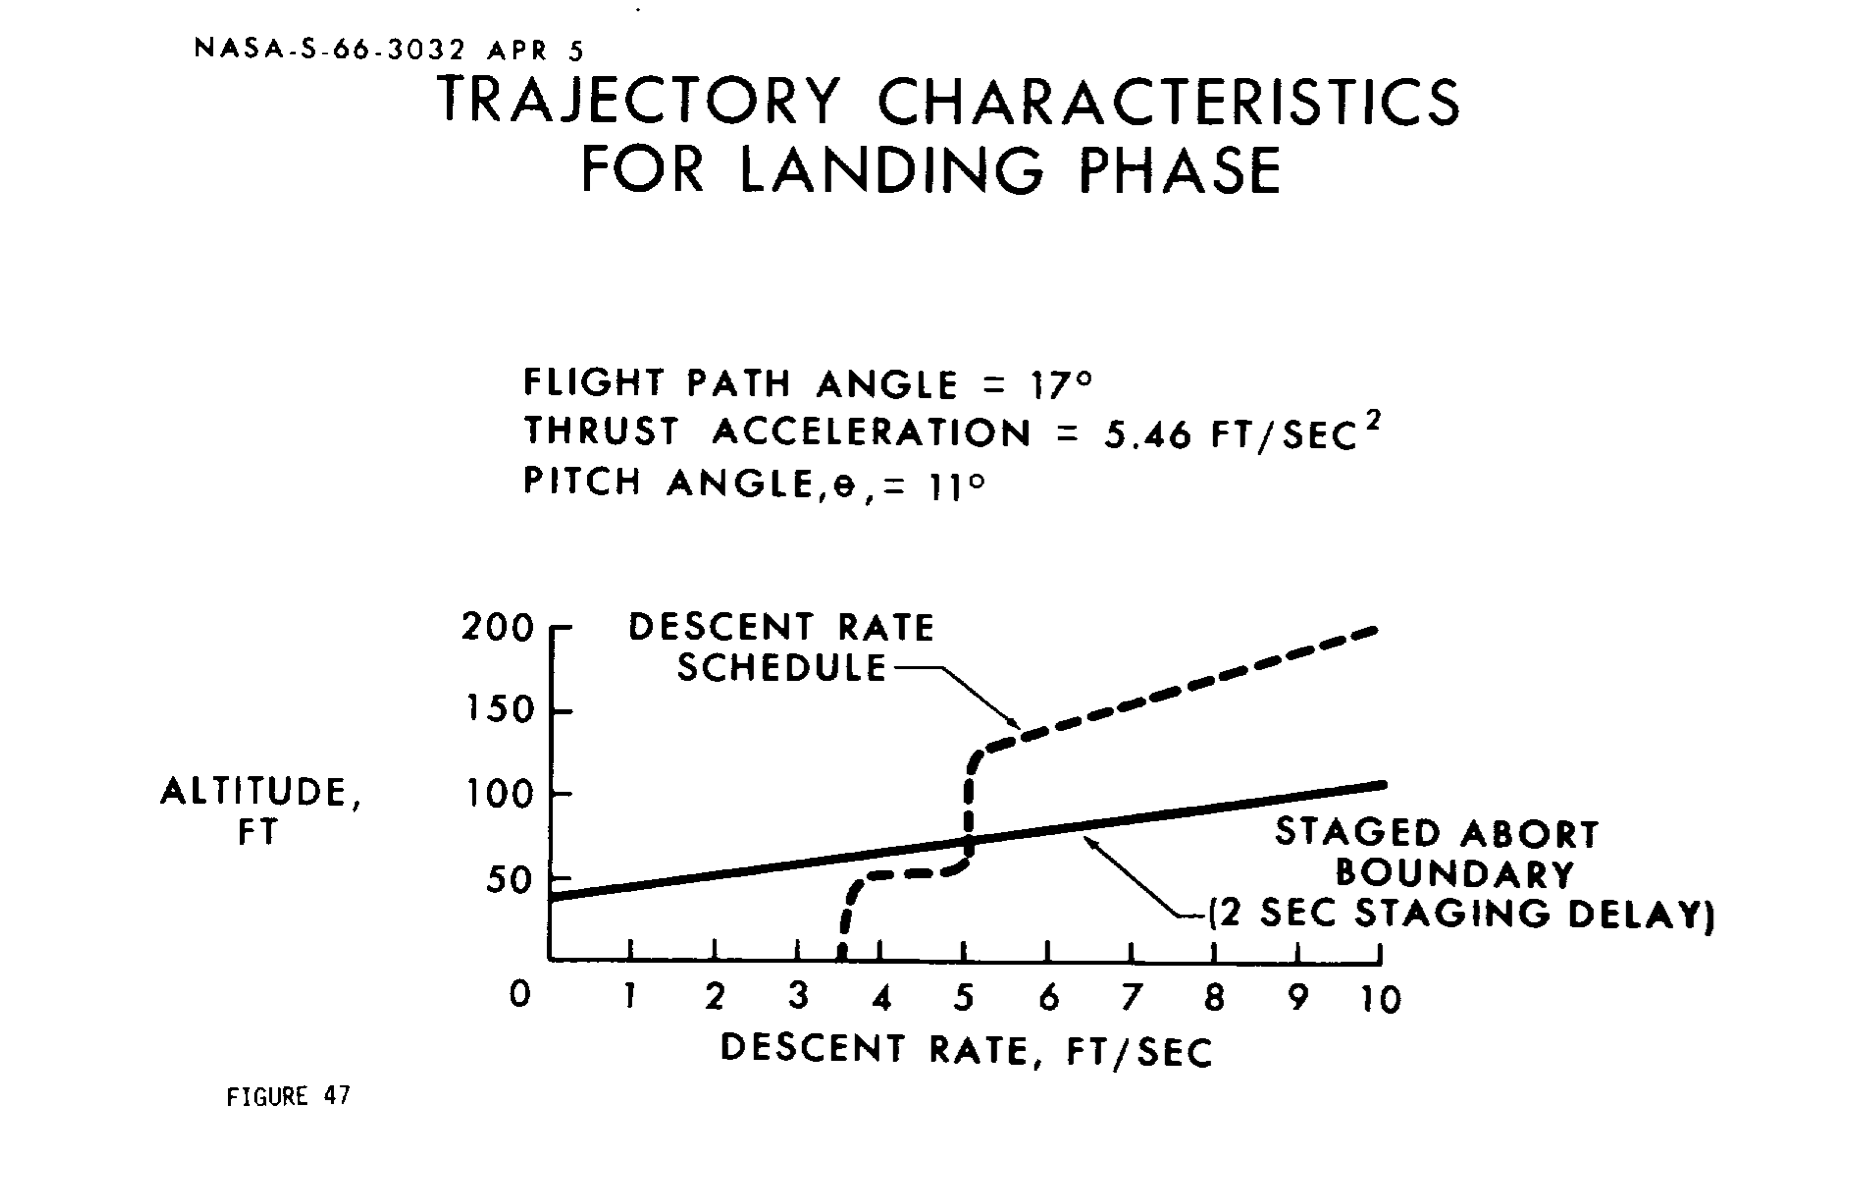
I did find this schedule in Apollo Lunar Module Landing Strategy, but I believe it is the schedule which would be used by the fully automatic landing, possibly not what humans were expected to do, and I'm interested in data up to at least 500 feet altitude (commanders went into P66 at varying altitudes from 240 to 550 feet).

enter image description here

I'm trying to program a "virtual LMP" for a landing simulator, who will deliver reasonably realistic callouts to assist the player in landing.
$\endgroup$
1
  • 1
    $\begingroup$ My former coworker at Az State wasn't able to come up with trajectory data. They basically just matched the window images by eye to create their simulation of the landing :( $\endgroup$ Commented Jan 16, 2020 at 5:51

2 Answers 2

19
$\begingroup$

Can someone find the descent rate profile that Duke is referring to here? Did LMPs look at a cheat sheet during the descent, or would they memorize key altitude-versus-ROD reference points?

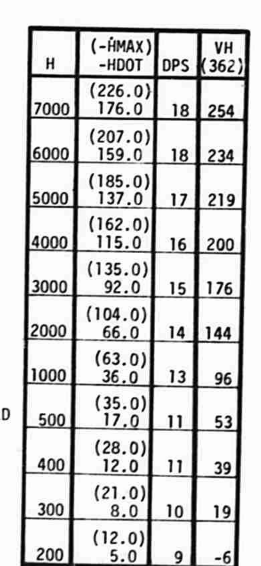
I think what you are looking for is on page 11 of the Apollo 16 LM Timeline Book. This is the checklist used by the crew during landing.

The numbers in the 200 ft box agree with the quote in your question.

And our profile calls for 5 foot per second, H-dot; and he's 11. And 12 was our maximum.

enter image description here

$\endgroup$
2
  • $\begingroup$ Yep, that’s what I was after. I guess below 200 feet it was “commander’s judgement” though. I believe the DPS column would be the expected fuel remaining percentage — some of the LMPs made comments like “plenty of gas” or “fat on fuel”, most likely comparing reported quantity to that chart. $\endgroup$ Commented Jan 16, 2020 at 14:53
  • $\begingroup$ Agreed, and VH is horizontal velocity. $\endgroup$ Commented Jan 16, 2020 at 15:07
16
$\begingroup$

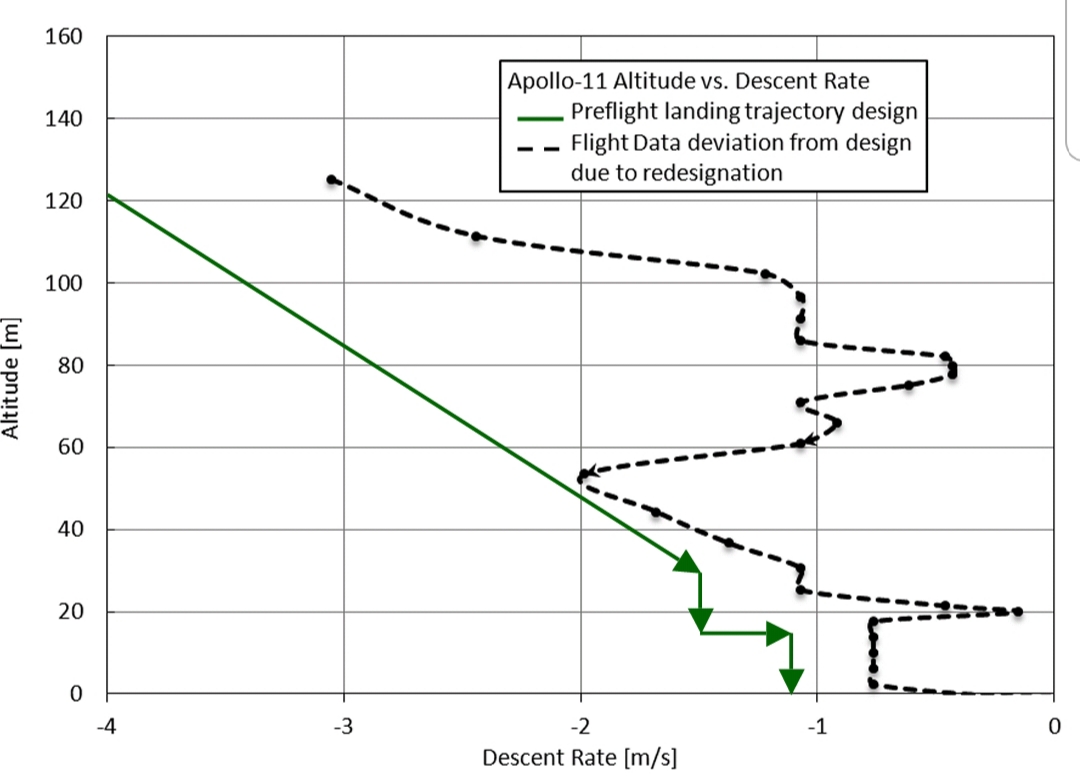
The paper "Fuel-efficient Descent and Landing Guidance Logic for a Safe Lunar Touchdown" by Allan Y. Lee, Jet Propulsion Laboratory, California Institute of Technology, Pasadena, California ( link to pdf ) contains the following plot of altitude vs altitude rate for Apollo-11:

enter image description here

The plot is claimed to be reconstructed using flight data from the following Apollo-11 report:

NASA Manned Spacecraft Center, Apollo 11 Guidance, Navigation and Control System Performance Analysis Report, 11176-H433-R0-00, Project Technical Report, Task E-38C, NAS 9-8166, December 31, 1969.

There are references to two other similar reports in the article: which presumably would contain similar rate of descent data for (see update below)

Apollo-12:

NASA Manned Spacecraft Center, Apollo 12 Guidance, Navigation and Control System Performance Analysis Report, 11176-H524-R0-00, Project Technical Report, Task E-38C, NAS 9-8166, April 8, 1970.

Apollo-14:

NASA Manned Spacecraft Center, Apollo 14 Guidance, Navigation and Control System Performance Analysis Report, MSC-04112 Supplement 1, Project Technical Report, Task E-38C, NAS 9-8166, January 1972.

Update. Found some links for the "Guidance, Navigation, and Control System Performance Analysis Reports": Apollo-12, Apollo-13, Apollo-14, Apollo-15, Apollo-16.

Whilst having some interesting data on accuracies of PGNCS and AGS and even things like RCS fuel consumption vs burn time plots during P63, P64 and P66 programs, there's not much information on the topic of this question, other than mentioning of single figures for the altitude and altitude rates at the time the P66 program was initiated:

Apollo-12: Horizontal velocity: 78.7 ft/s Altitude rate: -8.8 ft/s Altitude: 368.0 ft

Apollo-14: Horizontal Velocity: 34.5 ft/s Altitude Rate: -11.2 ft/s Altitude: 281 ft

Apollo-15: Horizontal Velocity: 29.8 ft/s Altitude Rate: -11.9 ft/s Altitude: 331 ft

$\endgroup$
4
  • 2
    $\begingroup$ That first plot is great — it fills in the low-altitude data that OM’s answer lacks. Thank you! $\endgroup$ Commented Jan 16, 2020 at 14:54
  • 1
    $\begingroup$ @RussellBorogove Following OM's example (for finding the cheatsheet the A-16 astronaus had), I've checked a few more timeline books, and the actual figures for Hdot below 500 ft altitude varies between the missions (sometimes relative variation is significant as the absolute value decreases towards zero). I.e. the planned profile wasn't precisely identical between the missions, for example, see A-14, A-12 $\endgroup$ Commented Jan 16, 2020 at 15:14
  • 1
    $\begingroup$ Interesting changes -- 200 at 9 down is uhh a little bolder than I would have guessed. I haven't yet added throttle response time to my sim... $\endgroup$ Commented Jan 16, 2020 at 21:30
  • $\begingroup$ @RussellBorogove Just a wild guess: maybe they eased-off the profile after Dave Scott smashed the LM pretty hard on surface. The rougher profile of A-12 and A-14 fits well with the 330ft-12ft/s where Scott picked it with P66. And, logically, it makes sense in easing off the profile for J-missions (heavier LM and longer nozzle bell on DPS engine) $\endgroup$ Commented Jan 17, 2020 at 1:36

Your Answer

By clicking “Post Your Answer”, you agree to our terms of service and acknowledge you have read our privacy policy.

Not the answer you're looking for? Browse other questions tagged or ask your own question.